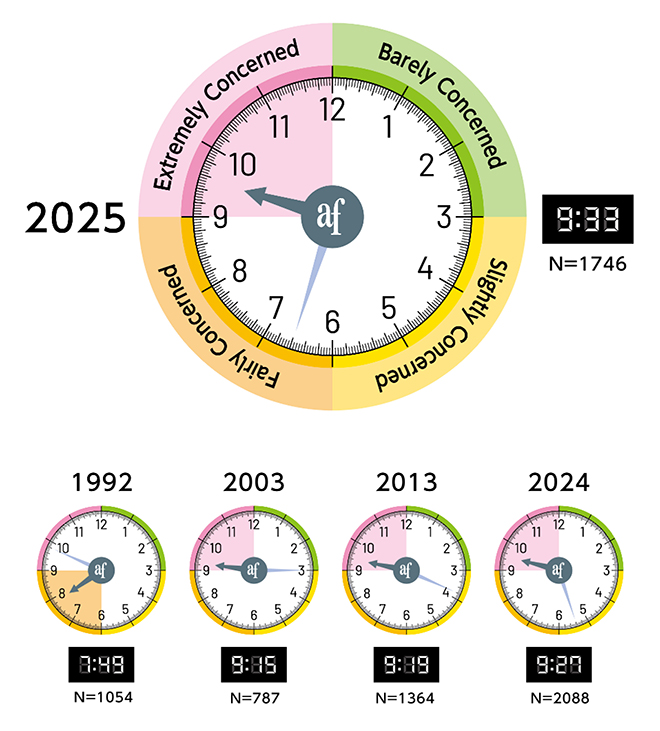
2.1 Level of the Crisis Facing Human Survival — The Environmental Doomsday Clock
The Environmental Doomsday Clock reflects the sense of crisis that the world’s experts on the environment feel about the survival of the mankind using the hands of a clock. Midnight signifies the time when we can no longer live as we have.
- The time on the Environmental Doomsday Clock moved forward by six minutes from last year, striking 9:33. From 2021 to 2024, the time on the Clock had gone back for those four consecutive years, but this is the first time in eight years since 2017 that it has shown a worsening situation of more than two minutes.
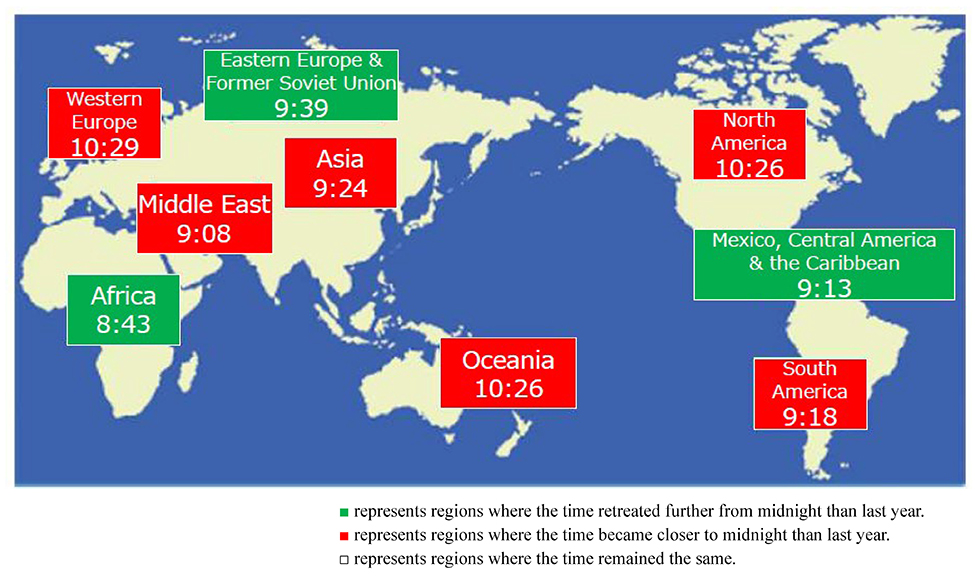
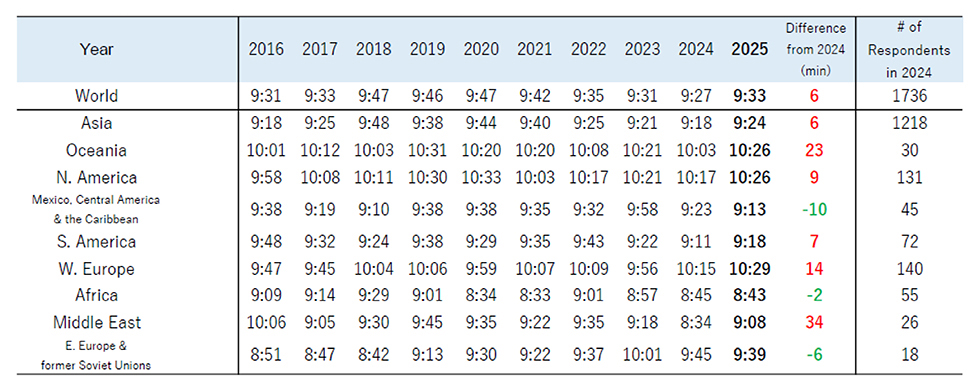
- By region, the time on the Clock moved forward in many areas including Asia, Oceania, North America, South America, Western Europe, and the Middle East. Notably, the time worsened significantly in the Middle East (by 34 minutes), Oceania (by 23 minutes), and Western Europe (by 14 minutes).
- The three most often selected categories of the “environmental issues to be taken into account” were the same as last year: “Climate Change” (29%), “Biosphere Integrity (Biodiversity)” (13%), and “Society, Economy and Environment, Policies, Measures” (13%).
- When ranking the "environmental issues to be taken into account" in order of descending time on the Clock, “Biosphere Integrity (Biodiversity)” (9:46), “Climate Change” (9:39), and “Society, Economy and Environment, Policies, Measures” (9:39) are all ahead of the global average time of 9:33. This global average has worsened by six minutes compared to the last years’ time of 9:27.
2.2 Awareness of the issues of Climate Change and Biodiversity Loss
Among the various environmental issues, climate change and biodiversity loss are garnering significant attention. From the three perspectives of “public awareness,” “policies and legal system,” and “social infrastructure,” we asked respondents about the progress of the “transition to a decarbonized society” for the mitigation of global warming and the “conservation and restoration of wildlife habitats” in their respective countries.
- With regard to the transition to a decarbonized society, the result shows that the advances made in “policies and legal system” and “social infrastructure” were less pronounced than those for “public awareness.”
- Relatively few people believe that the conservation and restoration of wildlife habitats is progressing in all aspects, and it is generally considered to be lagging behind the transition to a decarbonized society.
2.3 Awareness of 17 Sustainable Development Goals (SDGs)
We asked respondents about which SDGs are expected to have high or low achievement levels in 2030 in the respondents’ own country or region.
- The most commonly selected goals that will have the highest level of realization in 2030 were (in descending order) “18. There are no goals with any material level of realization in 2030 (25%),” “9. Industry, Innovation and Infrastructure (21%),” and “6. Clean Water and Sanitation (19%).”
- The most commonly selected goals that will have the lowest level of realization in 2030 were (in descending order) “1. No Poverty (33%),” “10. Reduced Inequalities (26%),” and “16. Peace, Justice and Strong Institutions (25%).”
2.4 Perceived Level of Achievement of overall Sustainable Development Goals (SDGs)
We asked respondents to rate the overall progress made so far toward achieving the 17 SDGs by 2030.
-
14.1% of respondents rated the current perceived level of overall SDG achievement as 0%, with 100% representing complete achievement of all goals. The average rating was 33.7%.
-
As of 2025, respondents in their 20s and 30s perceived the level of overall SDG achievement to be 40% or higher, while those in their 50s and older rated it below 30%, indicating a significant generational gap in perception.
2.5 Perceptions of Actions Needed to Solve Environmental Issues
We asked respondents whose actions they believe are most important in addressing environmental issues.
-
In all regions, the highest percentage of respondents answered that the central government plays the most important role.
-
By employment type, 51% of respondents working for corporations indicated that the actions of the central or local governments are most important. In contrast, only 27% of those working in the central government chose the central government as the most important sector.
-
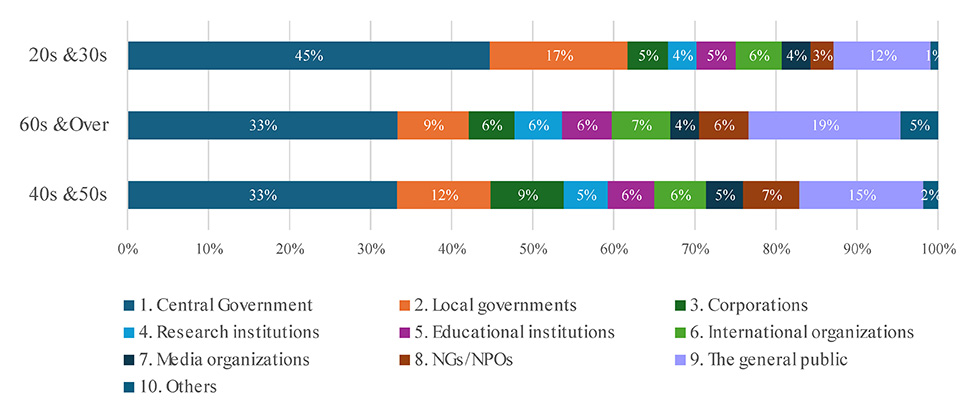
Among respondents in their 20s and 30s, 45% selected the central or local governments’ involvement, a higher proportion than in other age groups (33%).
3.1 Level of the Crisis Facing Human Survival – The Environmental Doomsday Clock
showhide
Question 1. In Table 5 on page 9, “Environmental issues to be taken into account” are shown. Keeping in mind the problems that the environment faces at a global level, please select the three most pressing issues for the country or the region where you reside. Then, please rank them in order of importance. Lastly, for each item, select a time using hours and minutes between 0:10 to 12:00, to indicate the level of crisis for that issue. For the purpose of calculating results, please select your times in units no smaller than 10 minutes.
*Regarding the calculation of the time on the Environmental Doomsday Clock
The time on the Environmental Doomsday Clock will be determined by taking the weighted average of the data. The issue ranked in first place will be weighed at 50%, second place at 30%, and third place at 20%.
If a respondent selected only two issues, the first-ranked issue is weighed at 62.5% and second place at 37.5%. If the respondent selected only one issue, the selected issue is weighed at 100%.
| Fig. 1 The Time on the Environmental Doomsday Clock |
|---|
 |
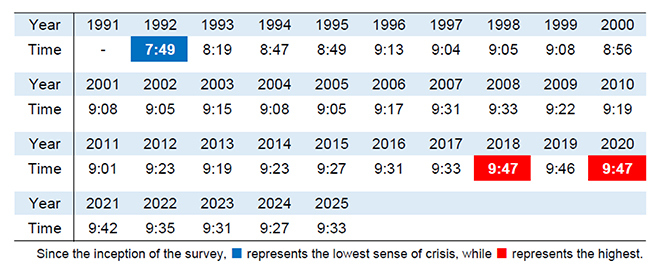
3.1.1 The Time on the Environmental Doomsday Clock
| Table 2 Change in the Time on the Environmental Doomsday Clock (World) since 1992 |
|---|
 |
| Fig.2 Change in the Time on the Environmental Doomsday Clock (World) since 1992 |
|---|
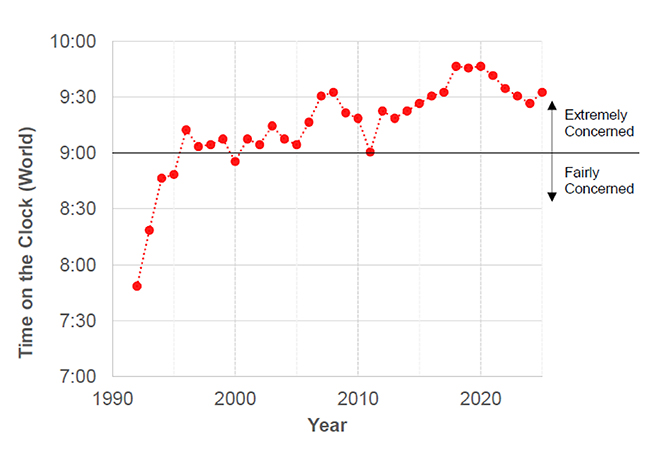 |
- The time on the Clock had been trending backward from 2020 to 2024, but this year it jumped forward by six minutes compared to the previous year.
| Fig.3-1 Regional Times on the Environmental Doomsday Clock |
|---|
 |
| Table 3 Changes in the Time on the Environmental Doomsday Clock Since 2016 |
|---|
 |
- As shown in Table 3, the time on the Environmental Doomsday Clock (the “time on the Clock”) for the world moved forward by 6 minutes, striking 9:33.
- Regionally, the time on the Clock moved forward significantly in Oceania (by 23 minutes) and the Middle East (by 34 minutes). This may be due in part to events such as the record-breaking warm winter in Australia in 2024, and the extreme heat in Mecca, Saudi Arabia, which reached 51.8°C in June and resulted in around 1,300 deaths during the Hajj pilgrimage.
- Western Europe was the only region in the world where the Clock moved forward by more than 10 minutes for two consecutive years. This may reflect the continuing impact of intense heatwaves in both 2023 and 2024, as well as growing concerns over energy supply instability caused by the prolonged Russia–Ukraine war.
Figure 3-2 shows the change in the time on the Environmental Doomsday Clock over the past ten years from the regions and countries with the highest number of respondents selected from Asia.
| Fig. 3-2 Change in the Time on the Environmental Doomsday Clock Since 2016 |
|---|
 |
-
In China, the time on the Clock had been moving backward from 2021 to 2024, but in 2025 it moved forward by 20 minutes. This may be influenced by the fact that 2024 was the hottest year on record in China and that massive flooding caused by heavy rainfall occurred in the southern part of the country.
-
In Taiwan, about 80% of respondents were in their 20s to 40s. They have consistently chosen a time in the 8 o'clock range, and since 2021, the time on the Clock has continued to move backward.
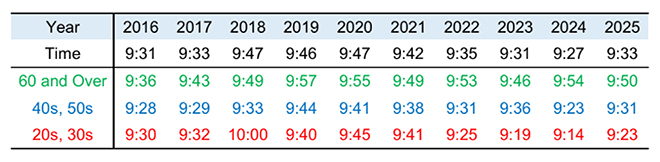
Table 4 and Fig. 4 show change in the time on the Clock by generation over the last 10 years (2015 – 2024).
| Table 4 Change in the Time on the Environmental Doomsday Clock by Generation |
|---|
 |
| Fig.4 Change in the Time on the Clock by Generation |
|---|
 |
- The survey respondents aged 60 and over tended to report more advanced times on the Clock than other age groups.
- This year, the time on the Clock moved forward among respondents in their 20s to 50s, while it moved backward among those aged 60 and over. A clear divide exists between older and younger generations in how they perceive the current state of environmental issues.
- Looking back over the past decade, the time indicated by respondents in their 20s had shown a tendency to move backward from 2020 to 2024, but in 2025, it moved forward for the first time in five years.
3.1.2 Environmental Issues to be Taken into Account
| Table 5 Environmental Issues to be Taken into Account |
|---|
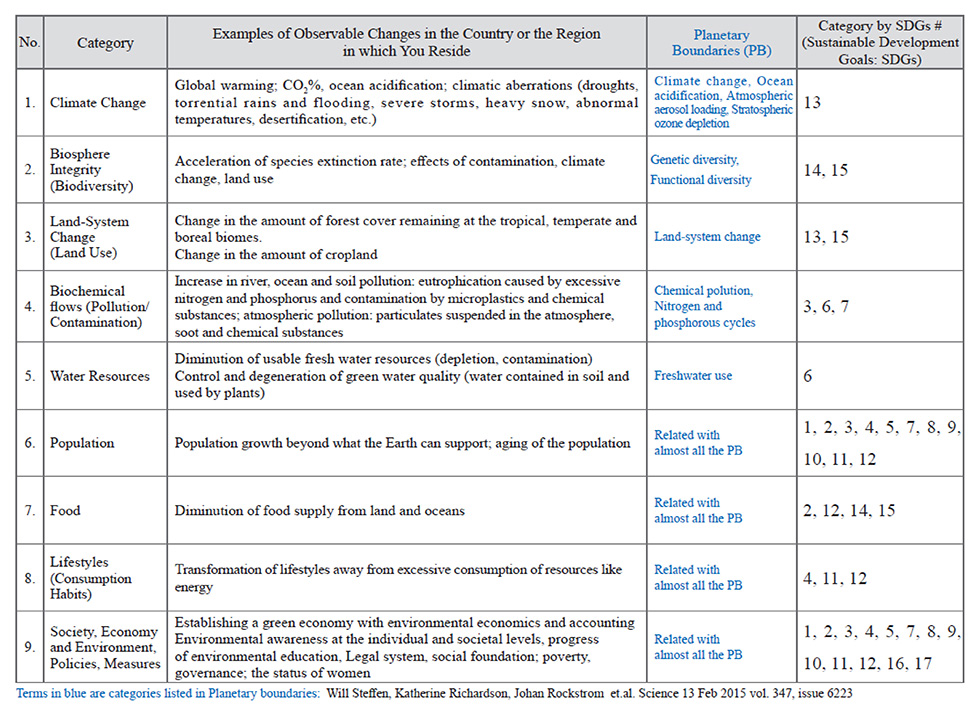 |
| Fig. 5 Sustainable Development Goals (SDGs) |
|---|
 |
3.1.2.1 Distribution of the Environmental Issues to be Taken into Account,
Showing Selection Percentage of Respondent’s 3 Most Pressing Issues and the Time on the Clock
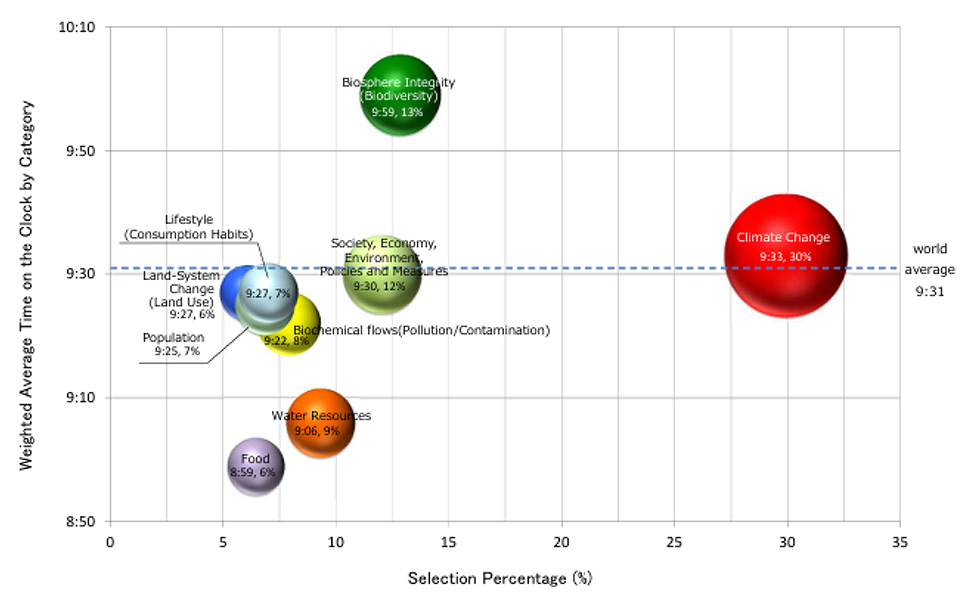
Fig. 6-1 2025 Distribution of the Environmental Issues to be Taken into Account,
Showing Selection Percentage of Respondent’s 3 Most Pressing Issues and the Time on the Clock |
|---|
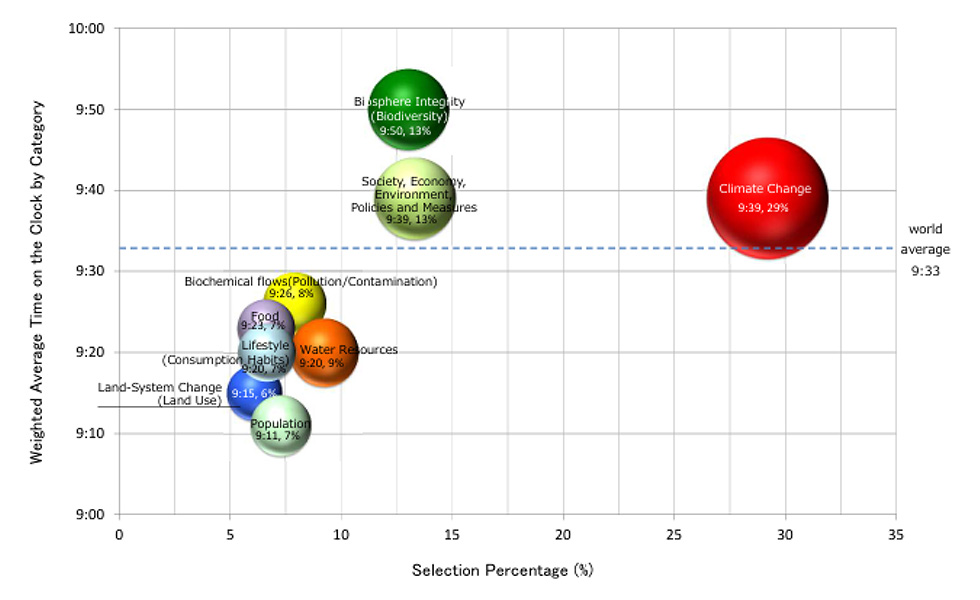 |
- As in the last year, “Climate Change” (29%) was the most often selected category among the “environmental issues to be taken into account,” which are used to calculate the time on the worldwide Environmental Doomsday Clock. This was followed by “Biosphere Integrity (Biodiversity)” (13%), “Society, Economy and Environment, Policies, Measures” (13%), “Water Resources” (9%), “Biochemical Flows (Pollution/Contamination)” (8%), “Lifestyle (Consumption Habits)” (7%), “Population” (7%), “Food” (7%), “Land-System Change (Land Use)” (6%). The percentage of each issue has changed little from last year.
- When arranging the “environmental issues to be taken into account” for the entire world in descending order of time on the Environmental Doomsday Clock, “Biosphere Integrity (Biodiversity)” (9:50) and “Climate Change” (9:39), and “Society, Economy and Environment, Policies, Measures” (9:39) were all closer to midnight than the world’s average time of 9:33. Below the average time were, “Biochemical Flows (Pollution/Contamination)” (9:26), “Food” (9:23), “Lifestyle (Consumption Habits)” (9:20), “Water Resources” (9:20), “Land-System Change (Land Use)” (9:15), and “Population” (9:11).
- In 2025, aside from “Biosphere Integrity (Biodiversity),” “Climate Change,” and “Society, Economy and Environment, Policies, Measures,” there was little difference between the time on the Clock and the selection percentages for the other issues.
Fig. 6-2 2024 Distribution of the Environmental Issues,
Showing Selection Percentage of Respondent’s 3 Most Pressing Issues and the Time on the Clock |
|---|
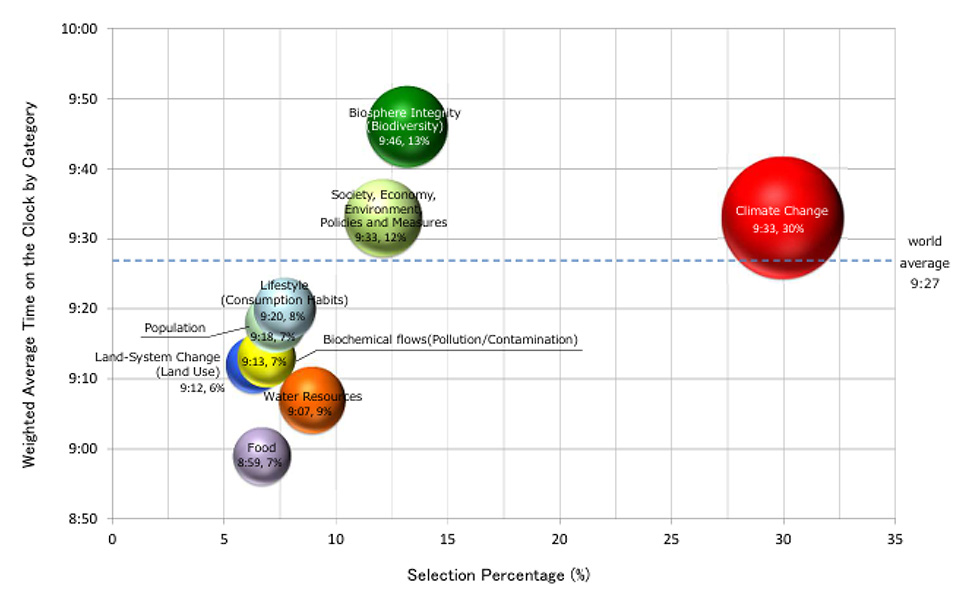 |
Fig. 6-3 2023 Distribution of the Environmental Issues to be Taken into Account,
Showing Selection Percentage of Respondent’s 3 Most Pressing Issues and the Time on the Clock |
|---|
 |
3.1.2.2 Selection Percentage for “Environmental Issues” by Region
| Table 6. Selection Percentage for “Environmental Issues” by Region |
|---|
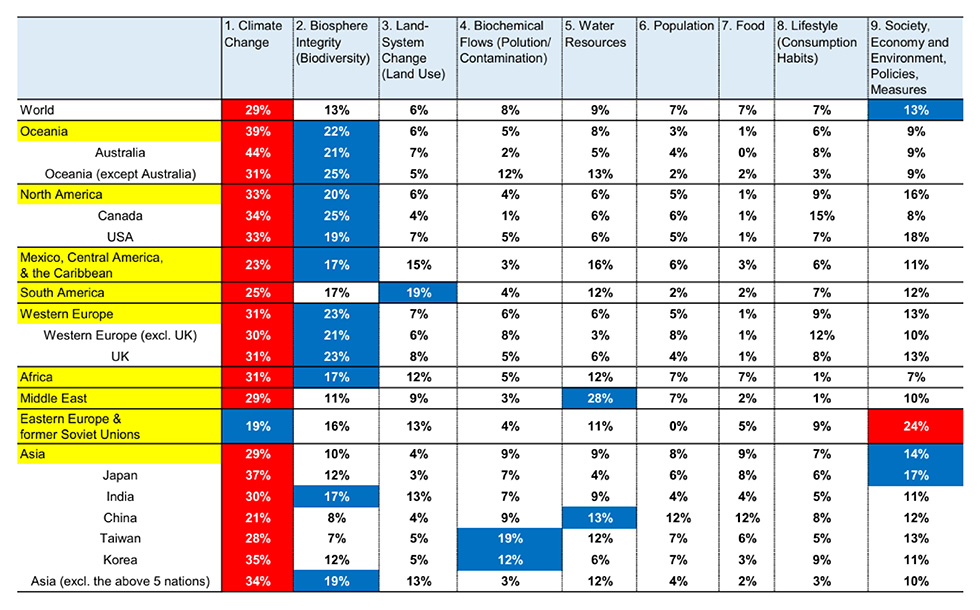 |
- In 2024, "Climate Change" (30%) was selected as the most pressing environmental issue to be taken into account in all regions.
-
By region, “Climate Change” was the most frequently selected "environmental issue to be taken into account" except in Eastern Europe and the former Soviet Union. This indicates that climate change is being felt across the globe. Following “Climate Change,” “Biosphere Integrity (Biodiversity)” (13%) was commonly selected in many regions. However, in Asia, “Society, Economy and Environment, Policies, Measures” ranked second.
-
In Asia, the issue selected after “Climate Change” varied by country: in China, it was “Water Resources”; in Taiwan and South Korea, “Biochemical Flows (Environmental Pollution)”; in India, “Biosphere Integrity (Biodiversity)”; and in Japan, “Society, Economy and Environment, Policies, Measures.” These results show notable differences within Asia.
3.1.2.3 Times on the Clock for Environmental Issues by Region
| Table 7. Times on the Clock for Environmental Issues by Region |
|---|
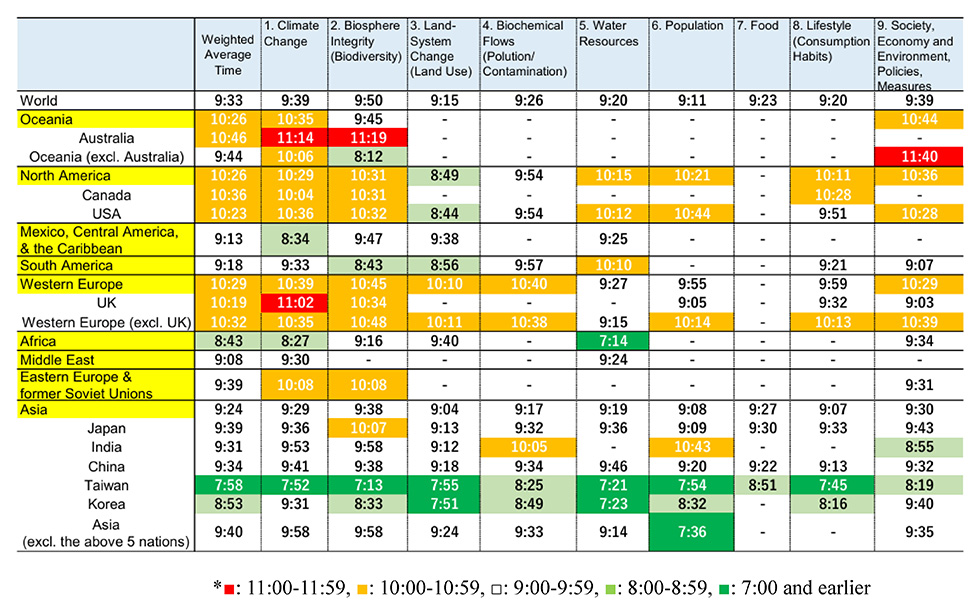 |
- The world’s average time on the Clock is 9:33. As for the environmental issues, the time on the Clock for “Biosphere Integrity (Biodiversity)” (9:50) is far ahead of that for “Climate Change” and "Society, Economy and Environment, Policies, Measures" (9:39).
- By region, a relatively heightened sense of crisis (times later than 10:30) was observed for “Biosphere Integrity (Biodiversity)” (10:44) , “Climate Change” (10:35) in Oceania; “Biosphere Integrity (Biodiversity)” (10:44) “Society, Economy and Environment, Policies, Measures” (10:36) in North America; and “Climate Change” (10:35) in Western Europe.
- By region, a relatively low sense of crisis (times earlier than 9:00) was observed for “Land-System Change (Land Use)” (8:49) in North America; “Climate Change” (8:34) in Mexico; Central America & the Caribbean; and “Climate Change” (8:27) and “Water Resources” (7:14) in Africa.
3.2 Awareness of the issues of Climate Change and Biodiversity Loss
showhide
Among the various environmental issues, climate change and biodiversity loss are garnering significant attention. From the three perspectives of "public awareness," "policies and legal system," and "social infrastructure," we asked respondents about the progress of the "transition to a decarbonized society" for the mitigation of global warming and the "conservation and restoration of wildlife habitats" in their respective countries.
Question 2-1: The Paris Agreement and SDGs were adopted in 2015 to promote efforts against global warming. Compared to before 2015, please answer the following question from three perspectives shown below. Do you think any progress is being made in a transition to a decarbonized society in your country/region?
Average scores were calculated by assigning the following values: '-2' for 'Not improved at all,' '-1' for 'Somewhat not improved, ''0' for 'Neither improved nor not improved,' '+1' for 'Somewhat improved,' and '+2' for 'Definitely improved. We used 30 or more responses to calculate the average score for each region or country.
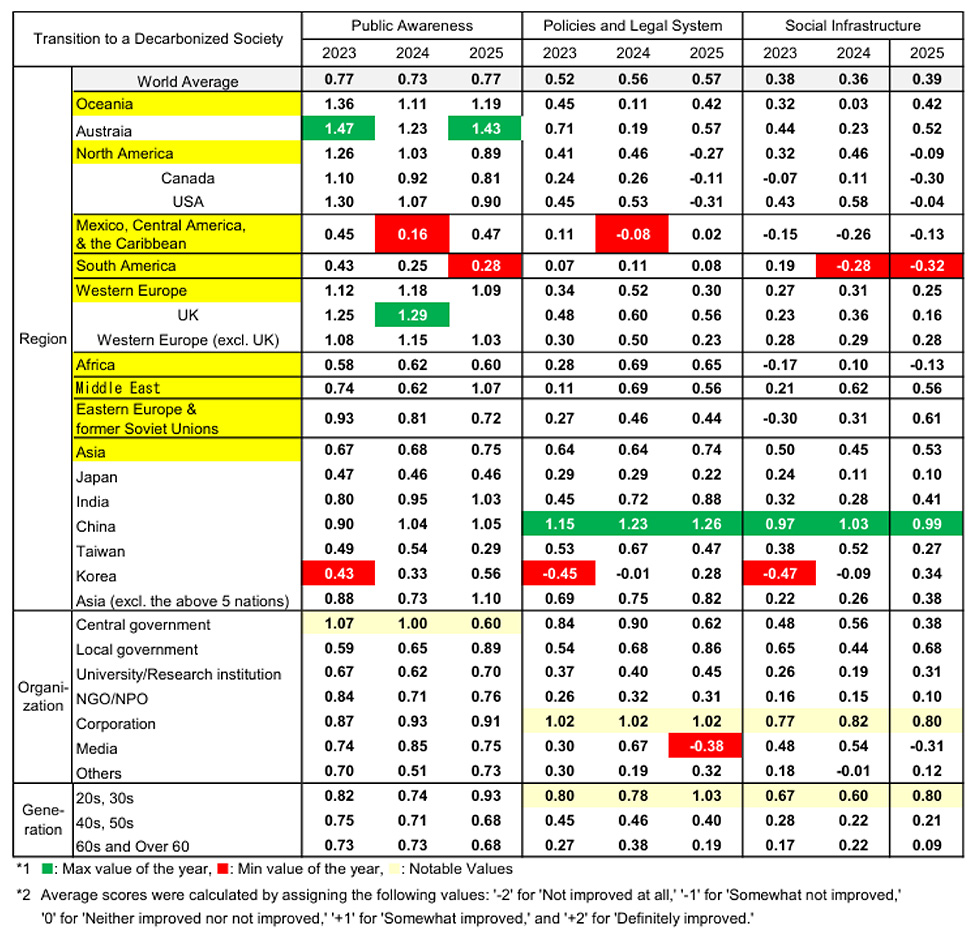
The average score for the entire world and for each region and country are shown in Table 8.
The world’s average scores are as follows:
- Public Awareness:+0.77
- Policies and Legal System:+0.57
- Social Infrastructure:+0.39
- Overall, with regard to transitioning to a decarbonized society, the results show considerably lower scores for three years running in “policies and legal system” and “social infrastructure (funds, human resources, technologies, and facilities)” compared to “public awareness.”
- Among Asian countries, Taiwan recorded the lowest scores in "Public Awareness," and Japan had the lowest scores in both "Policies and Legal System" and "Social Infrastructure."
- The scores for "public awareness" and "policies and legal system" varied by country and region. In China and Taiwan, the gap between the two was small, with the score for "policies and legal system" being slightly higher than that for "public awareness." In contrast, by region, in Oceania, North America, and Western Europe, the difference between the two was large, with progress in "policies and legal system" lagging significantly behind "public awareness." This trend has remained unchanged for the past four years.
- China has maintained the world's highest scores in "policies and legal system" and "social infrastructure" for three consecutive years. It seems that many respondents believe that the government is taking a leading role in the transition to a decarbonized society.
Table 8 Progress in a Transition to a Decarbonized Society:
World Average and Average Scores by Region, Organization, and Age Range |
|---|
 |
-
It is particularly noteworthy that in North America, the score for “policies and legal system” dropped significantly from 0.89 in 2024 to -0.27 in 2025. This likely reflects the impact of the change in the U.S. administration.
-
By type of organization, respondents from central governments showed a decline in scores across all perspectives, “public Awareness”, “policies and legal system,” and “social infrastructure,” compared to 2024. Among those in journalism, the scores for “policies and legal system” and “social infrastructure” dropped sharply, even into negative values, from their 2024 levels.
-
By age group, respondents in their 20s and 30s were more likely than other generations to believe that the transition to a decarbonized society is progressing in all perspectives.
Question 2-2: In 2022, the “Kunming-Montreal Global Biodiversity Framework” was adopted as a successor to the Aichi Targets, aiming to curb biodiversity loss. Compared to before 2022, please answer the following question from three perspectives shown below.
Do you think any progress is being made in the conservation and restoration of wildlife habitats I your country/region?
Table 9 shows the results analyzed for Question 2-2 from the three perspectives, “Public Awareness,” “Policies and Legal Systems,” and “Social Infrastructure,” in the same manner as in Question 2-1.
The world’s average scores are as follows:
- Public Awareness:+0.50
- Policies and Legal System:+0.43
- Social Infrastructure:+0.17
-
Globally, the progress on “Conservation and Restoration of Wildlife Habitats” scored 0.5 or lower across all perspectives, indicating that many respondents believe it is lagging behind efforts to address climate change. However, the scores in all aspects were higher than those in 2024.
-
Among the three perspectives, many respondents believe that "social infrastructure" are lagging behind "public awareness" and "policies and legal system."
-
Chinese respondents expressed a stronger belief than respondents from other regions that the conservation and restoration of wildlife habitats is progressing positively in China from all perspectives.
Table 9 Progress in the Conservation and Restoration of Wildlife Habitats:
World Average and Average Scores by Region, Organization, and Age Range |
|---|
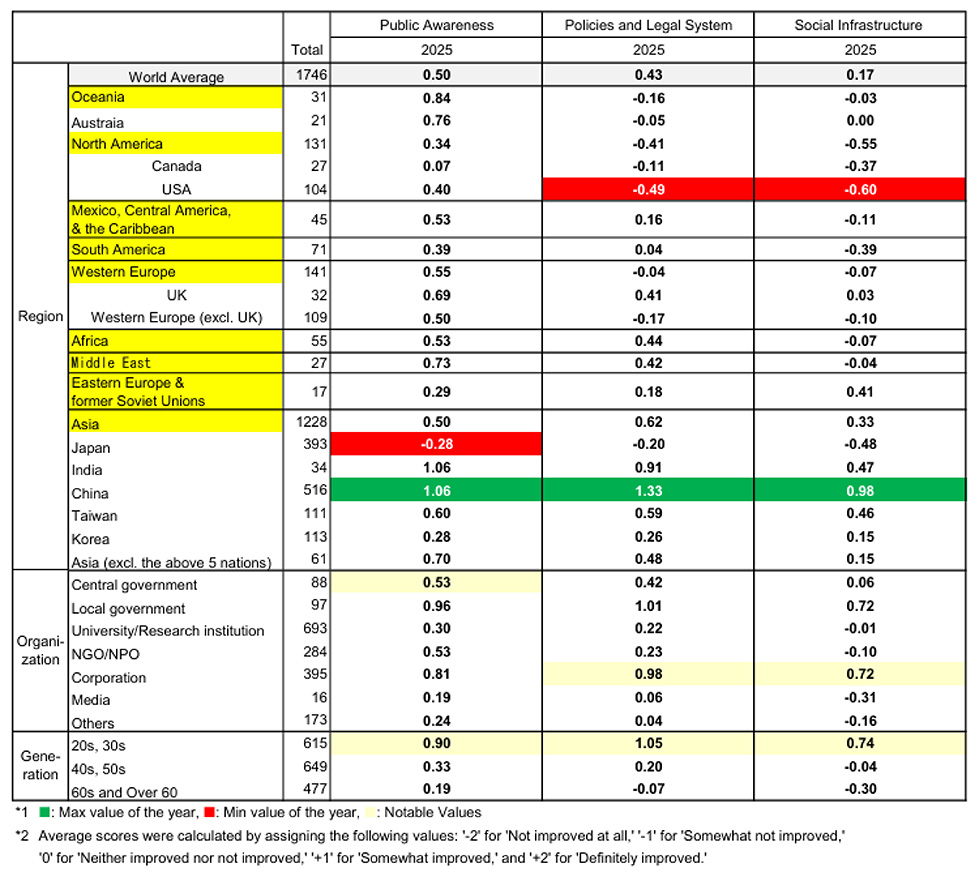 |
- In Japan, as in 2024, the scores are negative for all three perspectives, indicating that many respondents believe that the conservation and restoration of wildlife habitats is not progressing.
- In the United States, scores dropped significantly across all perspectives in 2025, with “policies and legal system” and “social infrastructure” recording the lowest values.
- Among central government respondents, scores declined in all perspectives—“public awareness,” “policies and legal system,” and “social infrastructure”—compared to 2024. In contrast, respondents from local governments and corporations reported higher scores in all perspectives, suggesting a perception that progress in the conservation and restoration of wildlife habitats is gradually being made.
- Respondents in their 20s and 30s expressed a more positive view of progress in the conservation and restoration of wildlife habitats across all perspectives compared to other age groups.
3.3 Awareness of the 17 Sustainable Development Goals (SDGs)
showhide
Question 3-1: Out of the 17 Sustainable Development Goals (SDGs), please select three goals that will have the highest level of realization in 2030. Then, rank them from highest (1st) to lowest (3rd) level of realization, while writing in the Goal numbers.
Three goals that will have the highest level of realization in 2030 were analyzed. Table 10 shows the percentage distribution of responses for each option in a multiple-answer question, based on the total number of respondents.
| Table 10 (Respondents’ Own Country/Region) Three Goals (out of 17 SDGs) That Will Have the Highest Level of Realization in 2030 (multiple answers) |
|---|
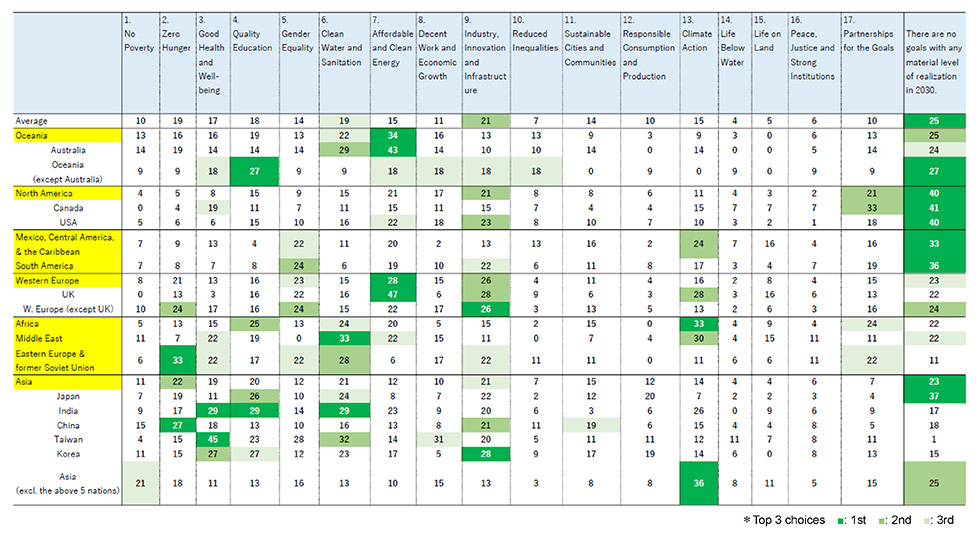 |
- The top three goals selected as likely to be achieved at a high level in respondents’ own countries or regions by 2030 were: “There are no goals with any material level of realization in 2030” (25%), “9. Industry, Innovation and Infrastructure” (21%), and “6. Clean Water and Sanitation” (19%).
- This is the first year that “There are no goals with any material level of realization in 2030” was the most selected option overall. This was most frequently chosen in Asia, North America, and Mexico, Central America & the Caribbean.
- In India, Mexico, Central America & the Caribbean; Africa, and the Middle East, many respondents selected “13. Climate Action” as the goal that will have the highest level of realization in 2030.
- In Mexico, Central America & the Caribbean; South America, Western Europe, and Eastern Europe & the Former Soviet Union, many respondents believed that “5. Gender Equality” would be achieved at a high level. In contrast, few respondents in the Middle East shared this view.
Question 3-2: Out of the 17 Sustainable Development Goals (SDGs), please select three goals that will have the lowest level of realization in 2030. Then, rank them from lowest (1st) to highest (3rd) level of realization, while writing in the Goal numbers.
Three goals that will have the lowest level of realization in 2030 were analyzed. Table 11 shows the percentage distribution of responses for each option in a multiple-answer question, based on the total number of respondents.
| Table 11 (Respondents’ Own Country/Region) Three Goals (out of 17 SDGs) That Will Have the Lowest Level of Realization in 2030 (multiple answers) |
|---|
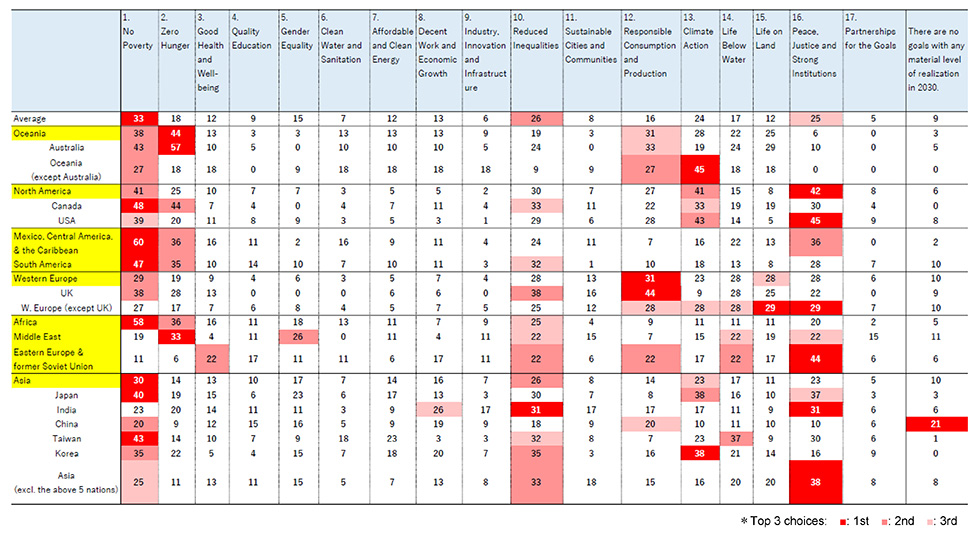 |
- In terms of goals considered least likely to be achieved in respondents’ own countries or regions by 2030, the most frequently selected were “1. No Poverty” (33%), “10. Reduced Inequalities” (26%), and “16. Peace, Justice and Strong Institutions” (25%).
- In the 2024 survey, “13. Climate Action” was among the top three goals considered least likely to be achieved, but this year it was replaced by “16. Peace, Justice and Strong Institutions.” With ongoing conflicts in Ukraine and the Middle East, this shift reflects the sentiments of respondents who are especially concerned about world peace at this point in time.
- A particularly high number of respondents in Japan and the Middle East believe that “5. Gender Equality” will be difficult to achieve in their own countries by 2030.
- Many respondents in Oceania, Western Europe, and Eastern Europe & the Former Soviet Union selected “12. Responsible Consumption and Production” as a goal they believe will have a low level of realization in their own countries.
3.4 Perceived Level of Achievement of overall Sustainable Development Goals (SDGs)
showhide
Question 4: As of 2025, based on your understanding, how much progress do you think has been made towards achieving the 17 SDGs overall? With 100% representing complete achievement of all goals, please provide a number from 1 to 100 in increments of 5.
Figure 7 shows the distribution of the average perceived level of all SDGs achievement as of 2025 among the 1,751 respondents. A total of 14.1% of respondents indicated a 0% achievement level, and the overall average perceived achievement level was 33.7%.
| Figure 7 Distribution of the average perceived level of all SDGs achievement as of 2025 |
|---|
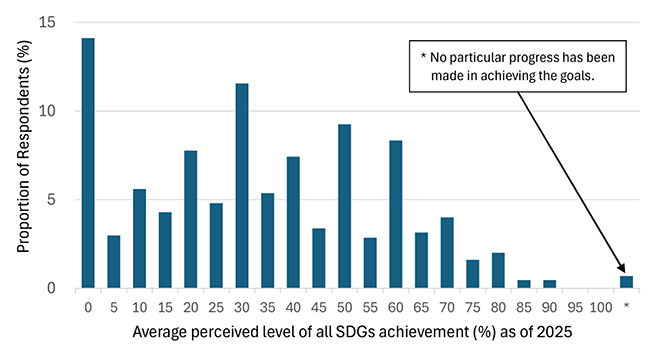
Average perceived level of all SDGs achievement (%) as of 2025 |
Figure 8 presents the average perceived level of all SDGs achievement as of 2025 by age group.
| Fig. 18 Average perceived level of all SDGs achievement (%) by generation |
|---|
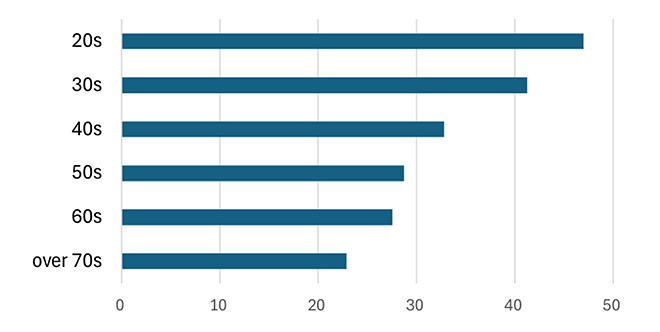 |
Respondents in their 20s and 30s feel that the level of SDG achievement as of 2025 is over 40%, whereas those in their 50s and older feel it has not even reached 30%, indicating a significant generational gap in perceptions of progress.
3.5 Perceptions of Actions Needed to Solve Environmental Issues
showhide
Question 5: Who do you think plays the most important role in solving environmental issues? Please choose one option from 1 to 10 below; and if possible, please provide the reason for your choice.
1. Central Government 2. Local governments 3. Corporations 4. Research institutions
5. Educational institutions (e.g., schools) 6. International organizations (e.g., the United Nations)
7. Media organizations 8. NGOs/NPOs 9. The general public. 10. Others
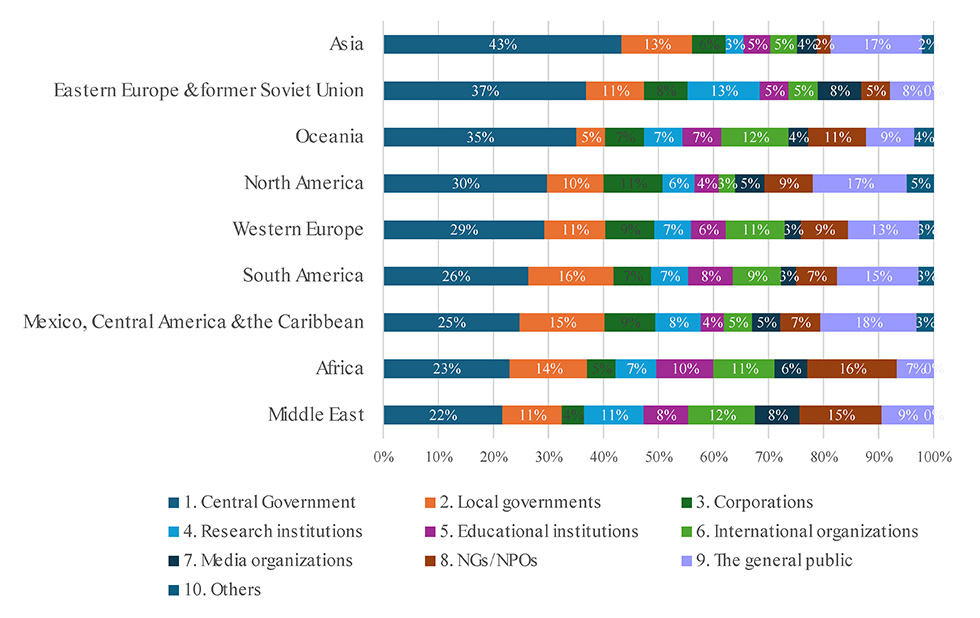
We asked respondents whose actions they believe are most important in addressing environmental issues. Figure 9-1 shows the percentage of respondents by region and their selected option in response to the question.
Fig. 9-1 Who plays the most important role in solving environmental issues?
(by Region) |
|---|
 |
-
In all regions, the highest percentage of respondents selected central government.
-
The proportion of those who chose central or local governments was higher in Asia and Eastern Europe & the Former Soviet Union, and lower in the Middle East and Africa.
-
While a significant number of respondents from many regions selected the general public as their 2nd or 3rd choice, the Middle East and Africa instead selected NGOs /NPOs over the general public by a wide margin.
Figure 9-2 shows the percentage of respondents by affiliation and their selected option in response to the question.
Fig. 9-2 Who plays the most important role in solving environmental issues?
(by Affiliation) |
|---|
 |
-
Among respondents from central governments and NGOs/NPOs, less than 30% selected the central government as the most important participant.
-
Among corporate respondents, 68% believed that the actions of central and local governments combined are the most important.
Figure 9-3 shows the percentage of respondents by age group and their selected option in response to the question.
Fig. 9-3 Who plays the most important role in solving environmental issues?
(by Age Group) |
|---|
 |
-
Among respondents in their 20s and 30s, the proportion of those who selected the central or local government was higher than in other age groups.
-
The respondents aged 60 and over selected the general public more often than those in younger age brackets did.
4 Closing Comment
The time on the Environmental Doomsday Clock moved back by a total of 20 minutes over four consecutive years, from 9:47 in 2020 to 9:27 in 2024. However, in 2025, for the first time in eight years, the time on the Clock moved forward by 6 minutes, striking 9:33. The ongoing wars in Ukraine and the Middle East, the United States’ second withdrawal from the Paris Agreement, and the continued occurrence of heatwaves and wildfires in many parts of the world in 2024 may all have contributed to the clock shifting forward.
In Question 1, with regard to “Environmental Issues to be Taken into Account,” which are used to decide the time on the Clock, while “Climate Change” was selected as the top issue in many regions, “Society, Economy and Environment, Policies, Measures” ranked first in Eastern Europe and the former Soviet Union. Notably, this option was also selected as the second most important issue globally, narrowly surpassing “Biosphere Integrity (Biodiversity),” indicating a significant shift in perception.
In Question 2, we examined the two most pressing issues—climate change and biodiversity loss—from three perspectives: public awareness, policies and legal system, and social infrastructure. In Question 2-2, regarding the conservation and restoration of wildlife habitats in respondents' own countries or regions, the majority of respondents in all regions, except China, believed that progress in this area is lagging behind that of climate change. However, compared to 2024, scores have improved across all three perspectives, suggesting that while progress may be slow, more people recognize that conservation and restoration efforts are moving ahead.
In Question 3, we explored respondents’ awareness of the Sustainable Development Goals (SDGs). When asked about the expected level of achievement in their own countries in 2030, 25% selected “There are no goals with any material level of realization.” Additionally, “16. Peace, Justice and Strong Institutions” was most frequently chosen (25%) as the goal least likely to be achieved, suggesting that ongoing global conflicts are influencing these responses.
In Question 4, respondents were asked about their perceived level of SDG achievement as of 2025. While many in their 20s and 30s felt that achievement was above 40%, a majority of those aged 50 and older believed it was below 30%, revealing a clear generational gap in perception.
In Question 5, which asked, “Who should play the most important role in solving environmental issues?”, a large number of respondents—particularly among the younger generation—selected “central government.” In contrast, among those affiliated with the central government, the proportion who answered that “the central government should play the most important role” was relatively small, underscoring a divergence in perceptions of how responsibilities should be shared among different sectors. Awareness of environmental issues varies significantly by factors such as region and generation, and this divergence is one aspect that may hinder their solution.
In conclusion, we have once again compiled a table summarizing the major environmental events that occurred around the world in the year preceding the survey response period. We hope you will find this table helpful as you interpret the results in this report.
We will continue using this current set of questions for some time. We appreciate your cooperation in participating in the survey again next year.