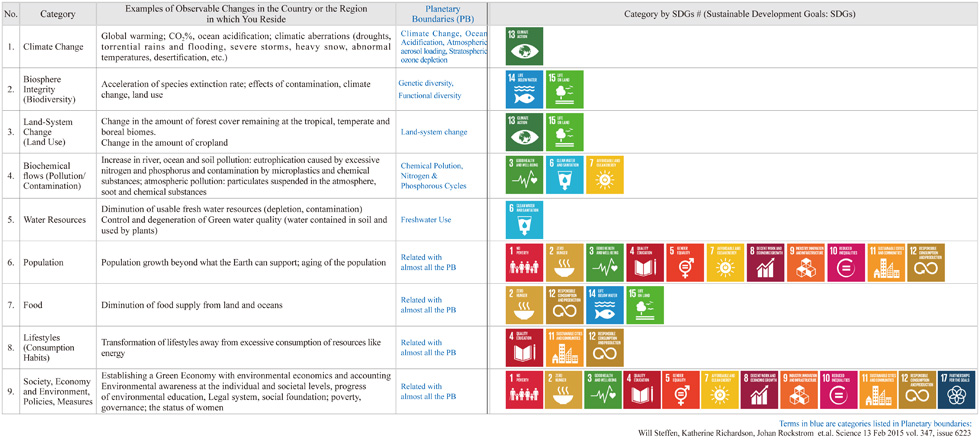
In Table2, “Environmental issues to be taken into account” are shown. Keeping in mind the problems that the environment faces at a global level, please select the three most pressing issues for the country or the region where you reside. Then, please rank them in the order of importance. Lastly, for each item, select a time using hours and minutes between 0:10 to 12:00, to indicate the level of crisis for that issue. For the purposes of calculating results, please select your times in units of 10 minutes.
About the calculation of the time on the Environmental Doomsday Clock
The time on the Environmental Doomsday Clock will be determined by taking the weighted average of the data. The issue ranked in first place will be weighted at 50%, second place at 30%, and third place at 20%.
In case of two valid responses, they will be weighted 62.5% and 37.5%, and 100% when it is only one.
A-1. The Environmental Doomsday Clock
| Fig.1 Concern about Human Survival Prospects |
|---|
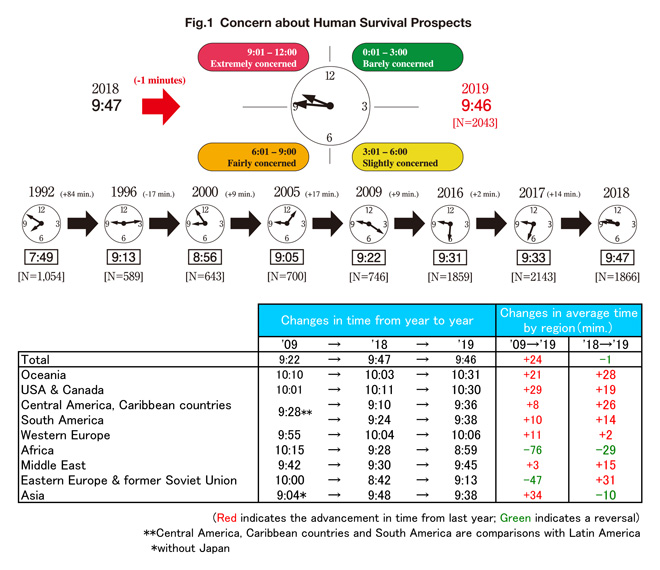 |
- The average time on the Environmental Doomsday Clock for all respondents was 9:46, which is one minute earlier than last year.
A-2. Shifts in the Environmental Doomsday Clock Based on Respondent Age (2011 - 2019)
- Survey respondents over the age60 tended to report the latest times on the Environmental Doomsday Clock.
There is a tendency for later times to be reported time to be later the older the respondent. Nevertheless the sense of environmental crisis among young respondents in their 20s and 30s was very high last year, while the time for those in their 40s and 50s remained largely same this year.
- The sense of crisis among respondents over the age of 60 has continued to increase since 2015.
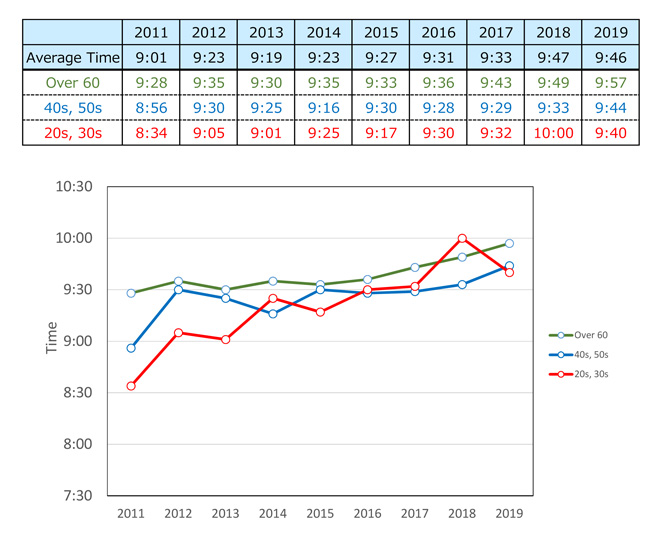
A-2-1. Shifts in the Environmental Doomsday Clock by Generation
- The times reported by respondents over the age of 60, (the most advanced times of all age groups), remained stable between 9:28 and 9:36, until 2016. However, the clock has moved forward since 2017, reaching 9:57 this year.
- The Environmental Doomsday Clock for respondents in their 40s and 50s has been stable around 9:30 since 2012, with this year being 11 minutes later than last year.
- The Environmental Doomsday Clock for respondents in their 20s and 30s had been increasing from 8:34 (2011) until 2016, and reached about the same level as that for those in their 40s and 50s in 2016 and 2017. Because of the high sense of crisis among Chinese respondents in their 20s and 30s, it was 10:00 last year, but it is 20 minutes earlier this year.
| Fig.4 Shifts in the Environmental Doomsday Clock by Generation |
|---|
 |
B. Environmental issues to be taken into account
B-1. Overall Analysis of the “Environmental Issues to Be Taken Into Account“
| Graph 1-1-1. Overall(2019) |
|---|
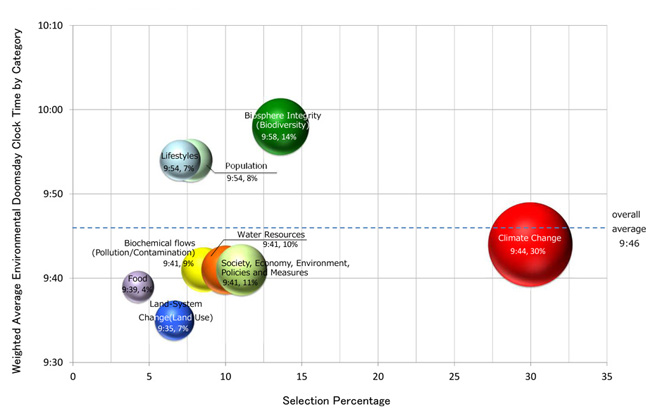 |
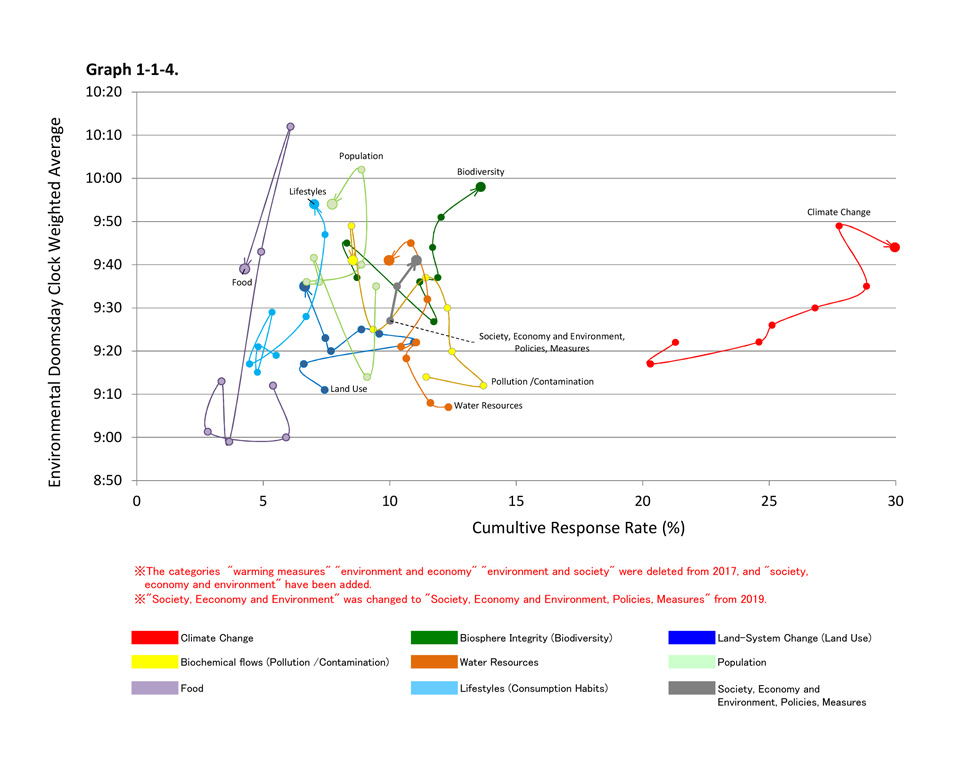
- Looking at “Environmental issues to be taken into account” when determining the world’s overall Environmental Doomsday Clock time, “Climate Change” (30%) was the most frequently selected, as it was last year, followed by “Biosphere Integrity (Biodiversity)” (14%), “Society, Economy and Environment, Policies, Measures” (11%), “Water Resources” (10%), “Biochemical Flows (Pollution/Contamination)” (9%), “Population” (8%), “Lifestyles” (7%), and “Land System Change (Land Use)” (7%).
- Likewise, in terms of “Environmental issues to be taken into account” for the whole world, “Biosphere Integrity (Biodiversity)” (9:58), “Population” (9:54), and “Lifestyles” (9:54) were ahead of the world average, followed by “Climate Change” (9:44), “Society, Economy and Environment, Policies, Measures” (9:41), “Water Resources” (9:41), and “Biochemical Flows (Pollution/Contamination)” (9:41).
- In comparison with 2018, clock times for “Biosphere Integrity (Biodiversity)” “Land-System Change (Land Use)” and “Lifestyles” have advanced, while the sense of crisis for “Food,” “Population,” and “Climate Change” has gone down. (Graph 1-1-4).
B-2. Distribution of the Environmental Conditions of Concern (2012 - 2019)
| Graph 1-1-4. |
|---|
 |
Do you see any signs of improvement in the approach to global environmental issues?
Please answer these questions from the following three viewpoints in comparison with before 2015 when the Paris Agreement and SDGs were adopted.
With signs of improvement in the approach to environmental issues being seen in the context of the three elements “Public Awareness,” “Policies, Legal System,” and social infrastructure “Funds, Human Resources, Technologies, and Facilities,”
we asked questions by category indicating the transition to a decarbonized society and each environmental issue.
We calculated averages by quantifying the replies as follows: -2 for “It definitely has not,” -1 for “It hasn’t really,” 0 for “Cannot say either way,” +1 for “It somewhat has,” and +2 for “It definitely has.”
We used samples of 30 or higher when calculating averages for regions and countries.
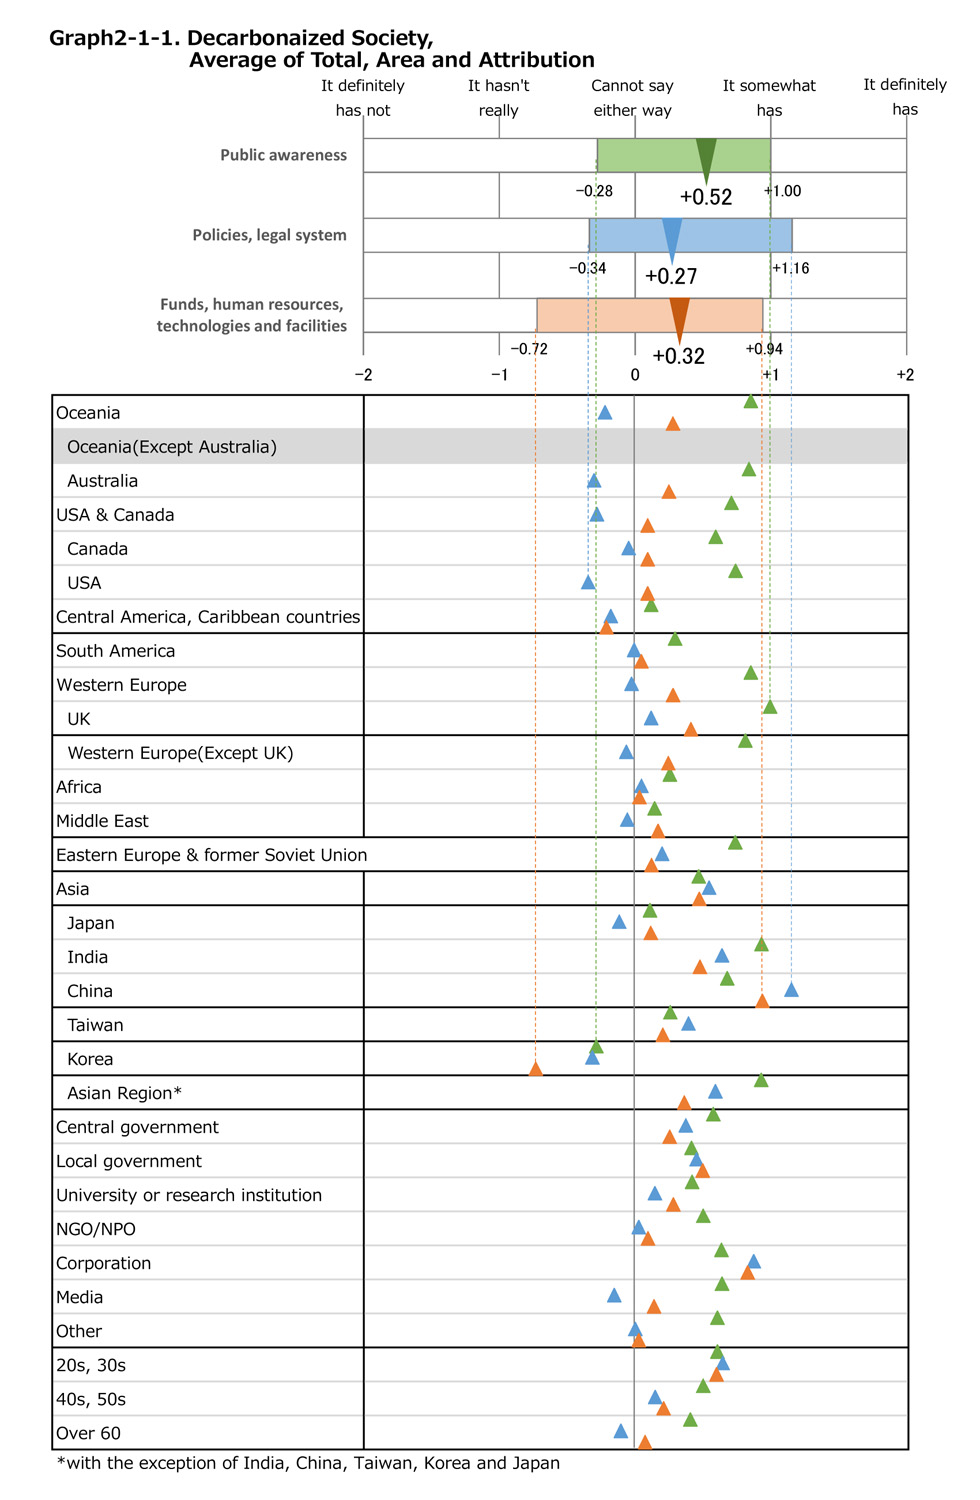
2-1 Do you think the society has been heading to decarbonized?
The world averages were as follows.
- Public Awareness+0.52
- Policies, Legal Systems+0.27
- Funds, Human Resources, Technologies, and Facilities+0.32
Overall, there were some signs of improvement in the approach to the transition to a decarbonized society,
but “Policies, Legal System” and social infrastructure “Funds, Human Resources, Technologies, and Facilities”
had not advanced as much as “Public Awareness.”
The only places where the value for “Policies, Legal System” was negative were Japan, Australia, USA, Canada,
Middle East Central America, and Western Europe (except UK), showing no improvements.
By contrast, the responses from China and Taiwan showed that rather than “Public Awareness,”“Policies, Legal System”
had advanced. The same trends could be seen in responses from business people by occupation type.
What stood out is that “Public Awareness” yielded a positive value only in Central America and
that “Cannot say either way” was the most frequent reply for all elements in Japan,
while “There are no sign of improvement” was the most frequent in Korea.
| Graph2-1-1. Decarbonaized Society, Average of Total, Area and Attribution |
|---|
 |
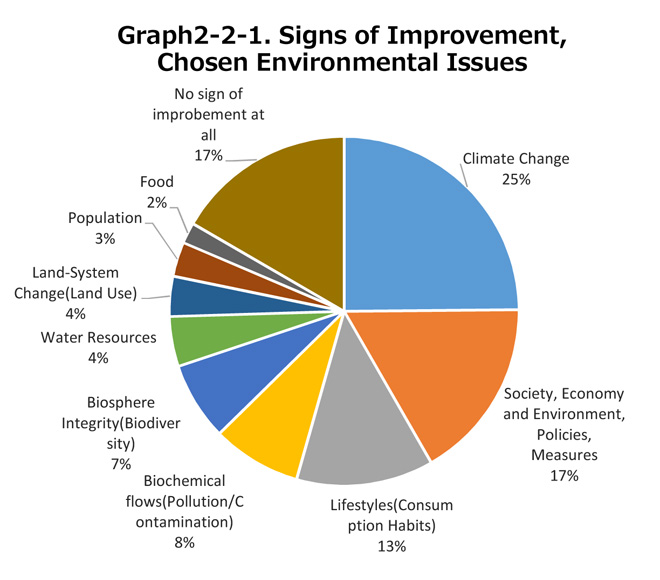
2-2 Where do you see signs of improvement? Please choose one category from the table 2 that shows a list “Environmental issues to be taken into account.”
The item most frequently selected for having signs of improvement was “Climate Change” at 25%,
followed by “Society, Economy and Environment, Policies, Measures” at 17%, and “Lifestyles” at 13%.
17% responded “There are no improvements at all.”
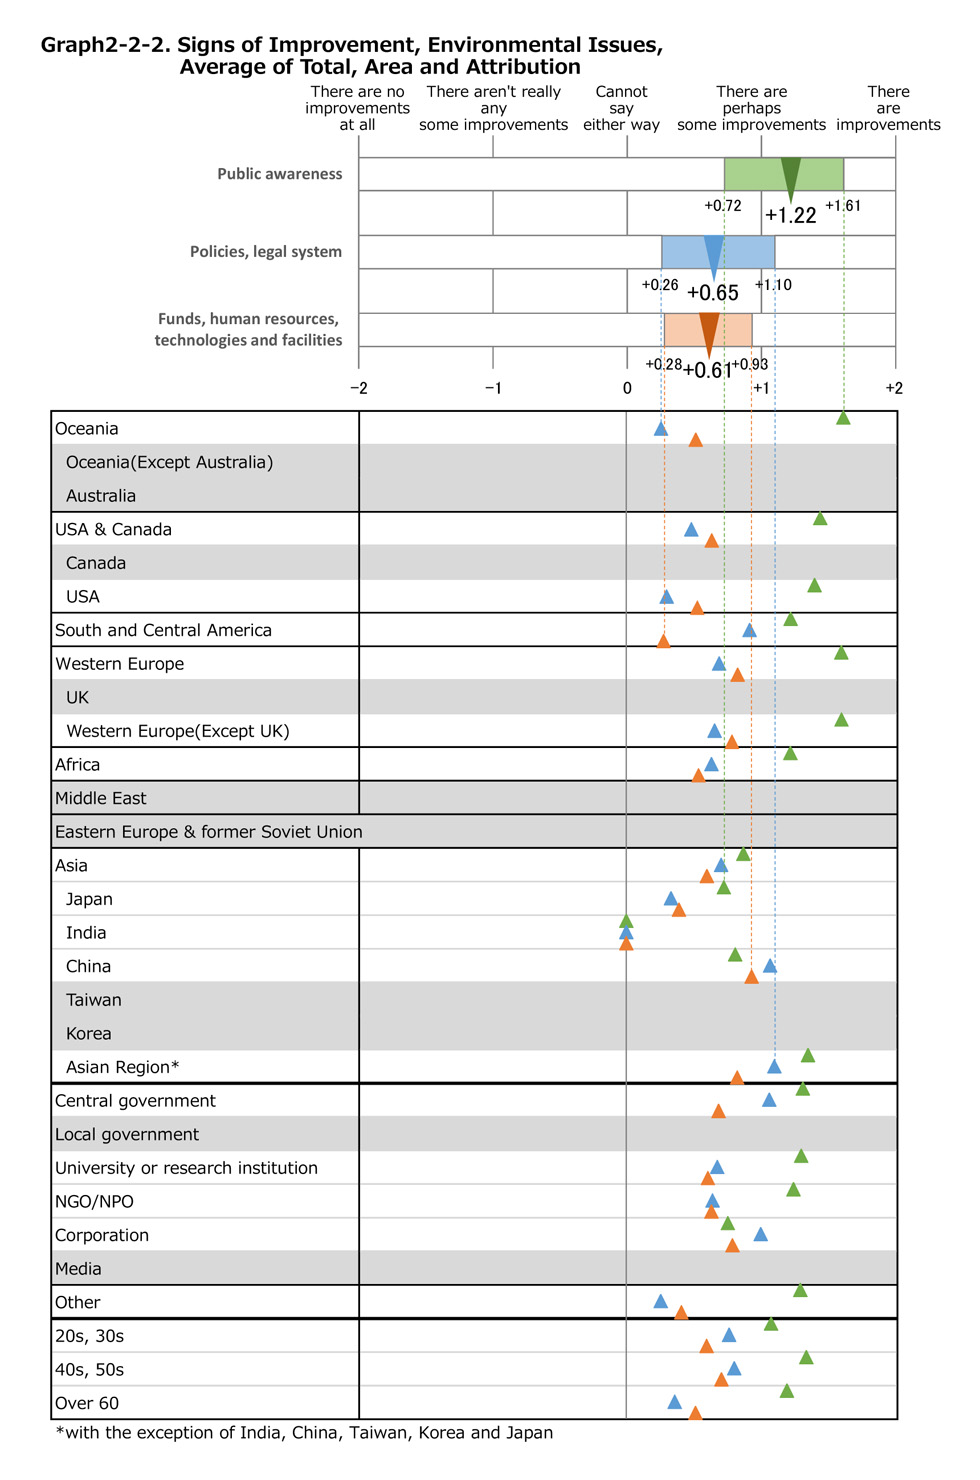
Graph 2-2-2 shows the averages for all responses and the averages for countries and regions with samples of 30 or more with
regard to “Climate Change,” which was selected most frequently.
The world averages were as follows.
- Public Awareness+1.22
- Policies, Legal Systems+0.65
- Funds, Human Resources, Technologies, and Facilities+0.61
For “Public Awareness,” the world average exceeded the value for “There are perhaps some improvements.”
Although a relative comparison, it was especially high in Oceania, Western Europe, and then North America.
The responses from Japan had the lowest average.
For “Policies, Legal Systems,” all of Asia and especially China score higher than the world average,
and it was relatively low in Oceania and USA&Canada despite the high “Public Awareness.”
For “Funds, Human Resources, Technologies, and Facilities” as social infrastructure,
it was high for China and Western Europe, but low for South and Central America.
No graphs were made for the other items as there were too few samples per country and region.
| Graph2-2-1. Signs of Improvement, Chosen Environmental Issues |
|---|
 |
| Graph2-2-2. Signs of Improvement, Environmental Issues, Average of Total, Area and Attribution |
|---|
 |
Comment
As shown by the recent late time of the Environmental Doomsday Clock, environmental crisis awareness has reached its highest
level since the start of this survey. Despite the critical situation, we conducted a survey involved environmental experts all
over the world to gauge if there has been any improvements or if things are only getting worse. As a standard, we make a
comparison with prior to the adoption of the International Framework Convention on Climate Change (Paris Agreement) and
the UN’s Sustainable Development Goals (SDGs) in 2015.
“Policies, Legal System” and social infrastructure “Funds, Human Resources, Technologies, and Facilities” differ depending
on the circumstances in countries or regions, so we show the variance between the total and the local by including world averages
and averages for countries or regions in one graph.
Looking at the advance of the transition to a decarbonized society in Q2-1, many results for so-called advanced countries were
negative in that “Policies, Legal System” had not advanced as much as “Public Awareness,” but interestingly, in China and
Taiwan, it seemed that “Policies, Legal System” has advanced more than “Public Awareness.”
For the items about signs of improvement in Q2-2, the order was “Climate Change,” “Society, Economy and Environment,
Policies, Measures,” and “Lifestyles.” Likewise, “Climate Change” was also the item selected most frequently as important
when thinking about environmental issues in Q1, so we can see a strong interest in the severity of the situation and the approach
to make improvements.
Even so, “Biosphere Integrity (Biodiversity),” which was picked second most frequently in Q1 and is a primary factor in the
advance of the Doomsday Clock, was only picked fifth in terms of whether signs of improvement can be seen, so we worry
that there are few signs of improvement and that the situation has become more serious.
For the future, we will continue using these same questions for a while, and continue conducting this survey while paying
attention to variance between world averages and those of countries and regions.
You might have found the questionnaire difficult to fill out, but we want to thank all responders for your help in providing
comments and good answers.