In Table 5 on page 7, “Environmental issues to be taken into account” are shown. Keeping in mind the problems that the environment faces at a global level, please select the three most pressing issues for the country or the region where you reside. Then, please rank them in the order of importance. Lastly, for each item, select a time using hours and minutes between 0:10 to 12:00, to indicate the level of crisis for that issue. For the purpose of calculating results, please select your times in units of no less than 10 minutes.
About the calculation of the time on the Environmental Doomsday Clock
The time on the Environmental Doomsday Clock will be determined by taking the weighted average of the data. The issue ranked in first place will be weighted at 50%, second place at 30%, and third place at 20%.
If a respondent selected only two issues, the first-ranked issue is weighted at 62.5% and second place at 37.5%. If the respondent selected only one issue, the selected issue is weighted at 100%.
Ⅲ-1-1. The Time on the Environmental Doomsday Clock
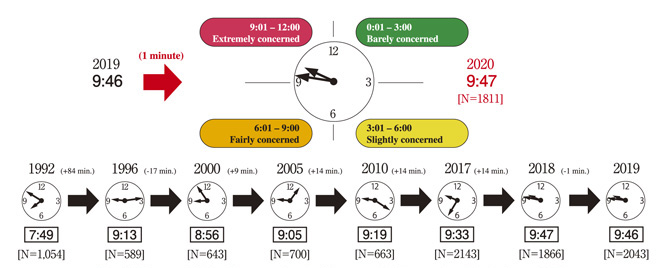
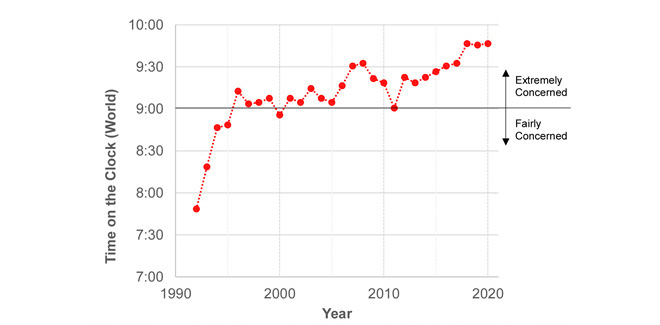
| Fig. 1 Changes in the Time on the Environmental Doomsday Clock since 1992 |
|---|
 |
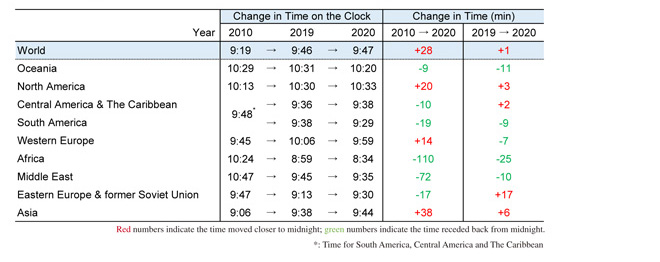
| Table 2 Changes in the Time on the Environmental Doomsday Clock over Time |
|---|
 |
- The time on the Clock for the world is 9:47, which is one minute closer to midnight than last year.
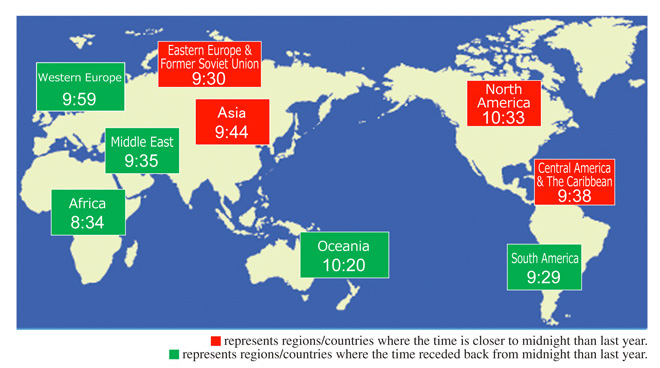
| Fig.2 Regional Times on the Clock |
|---|
 |
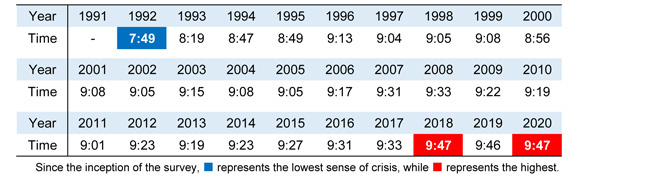
| Table 3. Changes in the Time on the Environmental Clock (World) since 1992 |
|---|
 |
| Fig.3 Changes in the Time on the Environmental Clock (World) since 1992 |
|---|
 |
Ⅲ-1-1-2. Changes in the Times on the Environmental Doomsday Clock by Generation
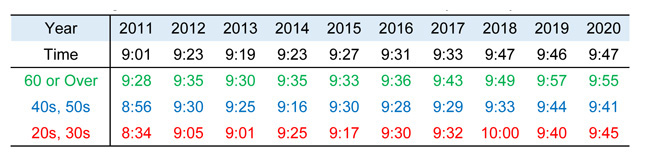
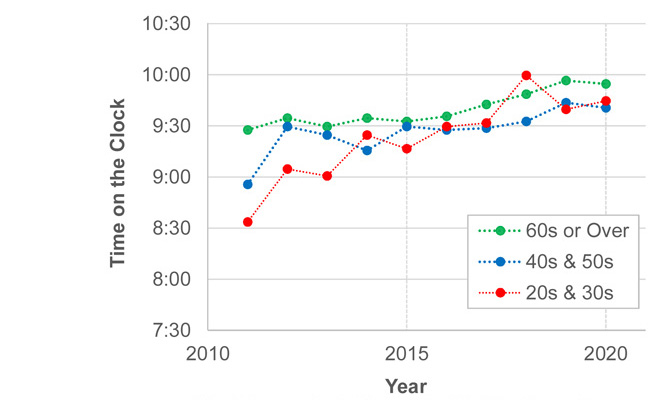
- The survey respondents aged 60 or over tended to report more advanced times on the Clock than other age groups.
- While all age groups are developing a stronger sense of crisis each year, the result shows only a a small change overoll from last year.
- The times reported by the respondents aged 60 or over were closer to midnight than the times reported by other age groups and remained stable (between 9:28 and 9:36) until 2016. The Clock started moving forward in 2017 and reached the upper 9:50 range last year and this year.
- The times reported by the respondents in their 40s and 50s remained stable at around 9:30 between 2012 and 2017, but advanced to the 9:40 range last year and this year.
- Times reported by the respondents in their 20s and 30s have kept moving forward since 2011 (when the Clock struck 8:34).In 2018, the time on the Clock hit 10:00 for these age groups due to the impact of the growing sense of crisis among the Chinese respondents in their 20s and 30s. It returned to the 9:40 range last year and this year.
| Table 4 Changes in the Times on the Environmental Doomsday Clock by Generation |
|---|
 |
| Fig.4 Changes in the Time on the Clock by Generation |
|---|
 |
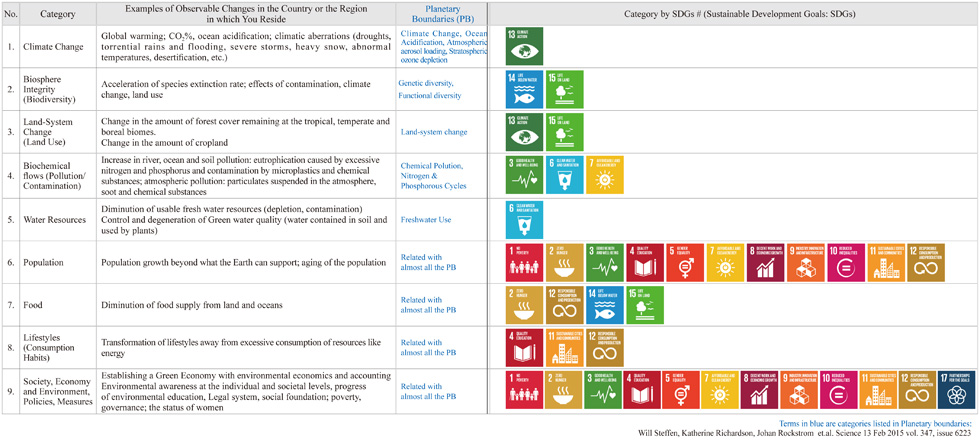
Ⅲ-1-2. Environmental Issues to be Taken into Account
| Table 5 Environmental Issues to be Taken into Account |
|---|
 |
Ⅲ-1-2-1. Distribution of the Environmental Issues
| Fig. 5-1 2020 Distribution of the Environmental Issues |
|---|
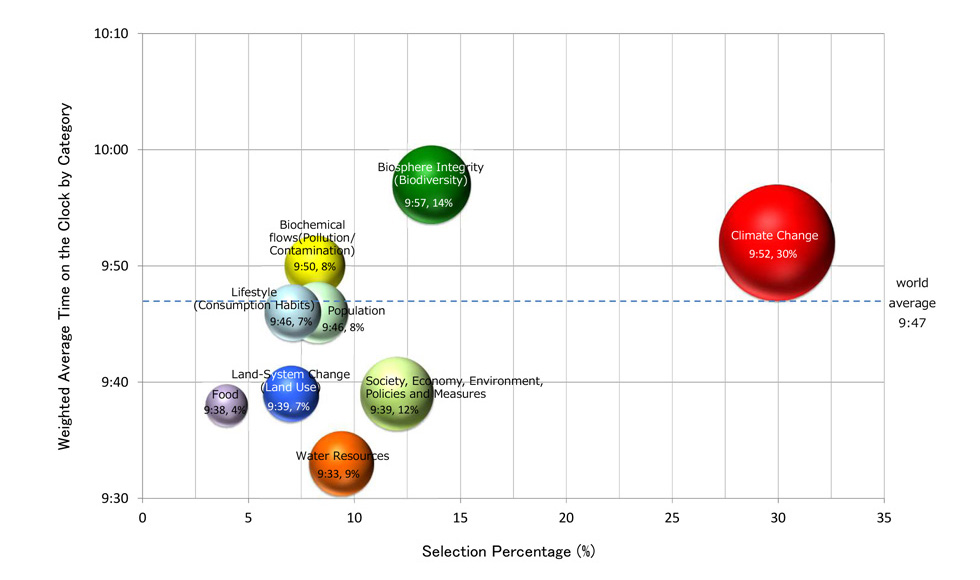 |
- As in the last year, “Climate Change” (30%) was the most often selected category among the “environmental issues to be taken into account,” which are used to calculate the time on the worldwide Environmental Doomsday Clock. This was followed by “Biosphere Integrity (Biodiversity)” (14%), “Society, Economy and Environment, Policies, Measures” (12%), “Water Resources” (9%), “Population” (8%), “Biochemical Flows (Pollution/Contamination)” (8%), “Lifestyles” (7%), “Land-System Change (Land Use)” (7%), and “Food” (4%).
- When arranging the “environmental issues to be taken into account,” for the entire world on the Environmental Doomsday Clock, “Biosphere Integrity (Biodiversity)” was at 9:57, “Climate Change” 9:52, and “Biochemical Flows (Pollution/Contamination)”9:50 were closer to midnight than the world’s average time, followed by “Population” 9:46, “Lifestyles” 9:46, “Society, Economy and Environment, Policies, Measures” 9:39, “Land-System Change (Land Use)” 9:39, “Food” 9:38, and “Water Resources” 9:33.
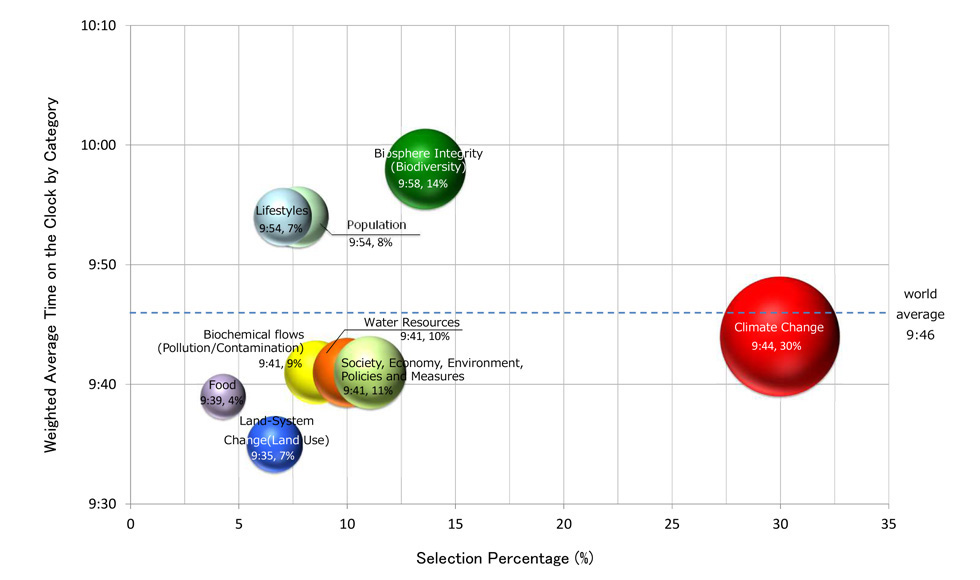
| Fig. 5-2 2019 Distribution of the Environmental Issues |
|---|
 |
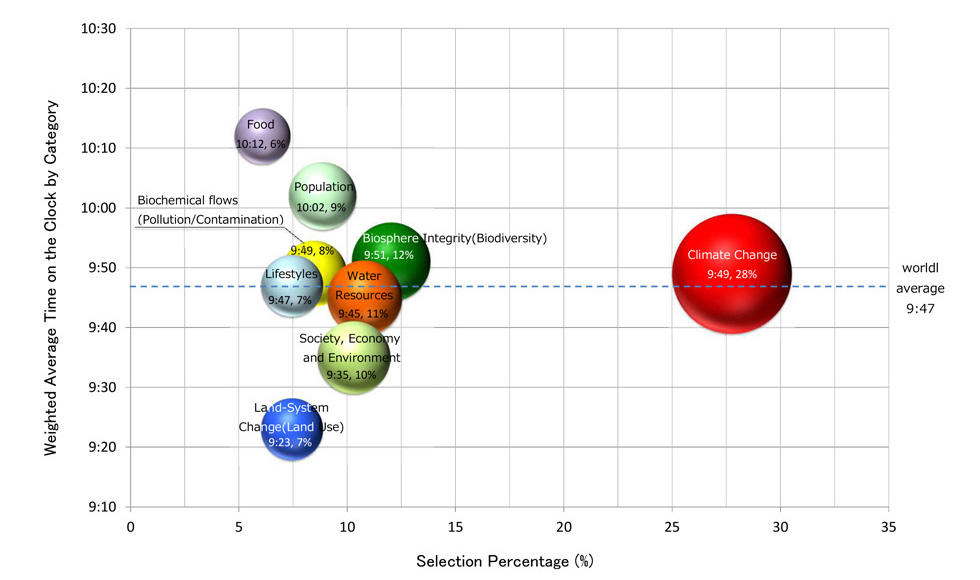
| Fig. 5-3 2018 Distribution of the Environmental Issues |
|---|
 |
Ⅲ-1-2-2. Annual Change of the Time on the Clock and Selection Percentage of Environmental Issues-FY2012-2020
| Fig. 6 Annual Change of the Time on the Clock and Selection Percentage of Environmental Issues-FY2012-2020 |
|---|
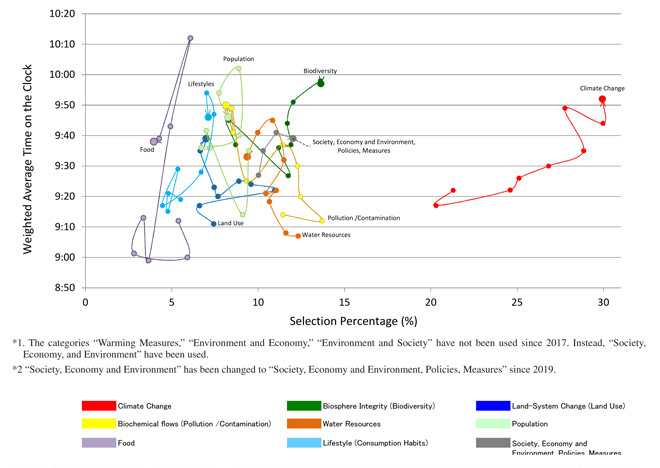 |
- While the selection rates of “Biosphere Integrity (Biodiversity)” and “Lifestyle” have not changed significantly since 2016, their times on the Clock have moved closer to midnight by 20 and 29 minutes, respectively. Meanwhile, the selection rate of “Climate Change” has increased 9.6 percentage points since 2013 and its time on the Clock has moved 35 minutes closer to midnight.
Ⅲ-1-2-3. Selection Percentage for “Environmental Issues” by Region
| Table 6. Selection Percentage for “Environmental Issues” by Region |
|---|
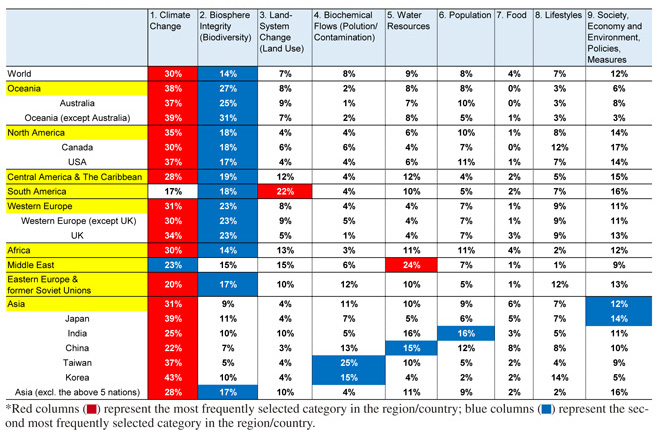 |
- “Climate Change” was the issue that the respondents worldwide most often selected as the most pressing environmental issues to be taken into account (30%), which is almost at the same level as last year, followed by “Biosphere Integrity (Biodiversity)” (14%). This trend is shown in many geographical regions.
- Regional differences emerged, however, in the second most often selected category, as it was “Population” in India, “Water Resources” in China, “Biochemical Flows (Pollution/Contamination)” in Taiwan and Korea, and “Society, Economy and Environment, Policies, Measures” in Japan.
- While “Climate Change” has the highest selection rate worldwide, the respondents in the Middle East and South America most often selected “Water Resources” and “Land-System Change (Land Use),” respectively.
Ⅲ-1-2-4. Times on the Clock for Environmental Issues by Region
| Table 7. Times on the Clock for Environmental Issues by Region |
|---|
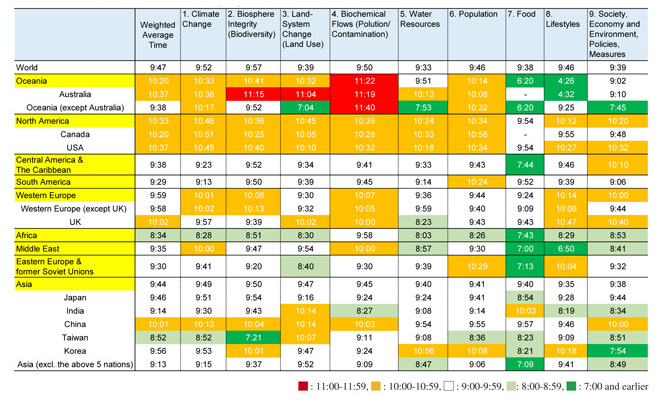 |
- The world’s average time on the Clock is 9:47. Only three issues, namely “Climate Change” (9:52), “Biosphere Integrity (Biodiversity)” (9:57), and “Biochemical Flows (Pollution/Contamination) (9:50), are closer to midnight than the world’s average time.
- In Australia, the Environmental Doomsday Clock moved beyond 11:00 for three issues, namely “Biosphere Integrity (Biodiversity),” “Land-System Change (Land Use),” and “Biochemical Flows (Pollution/Contamination),” showing a noticeably heightened sense of crisis for these areas.
Question 2-1: Do you see any signs of improvement in the approach to global environmental issues? Please answer these questions from the following three viewpoints in comparison with before 2015 when the Paris Agreement and SDGs were adopted.
Signs of improvement were investigated from the three perspectives, “Public Awareness,” “Policies and Legal System,” and “Social Infrastructure (Funds, Human Resources, Technologies, and Facilities). We asked the respondent’s opinion on whether there have been signs of improvement in the approach to global environmental issues with respect to a decarbonized society and where they saw signs of improvement for from a list of “Environmental Issues to be Taken Account.”
We calculated the average score by quantifying the answers giving a score of “-2” for the answer “Not improved at all,” “-1”for the answer “Somewhat not improved,” “0” for the answer “Neither improved or not improved,” “+1” for the answer “Somewhat improved,” and “+2” for the answer “Definitely improved.” We used 30 or more samples to calculate the average score for each region or country.
Question 2-1 Do you think that we are shifting to a decarbonized society?
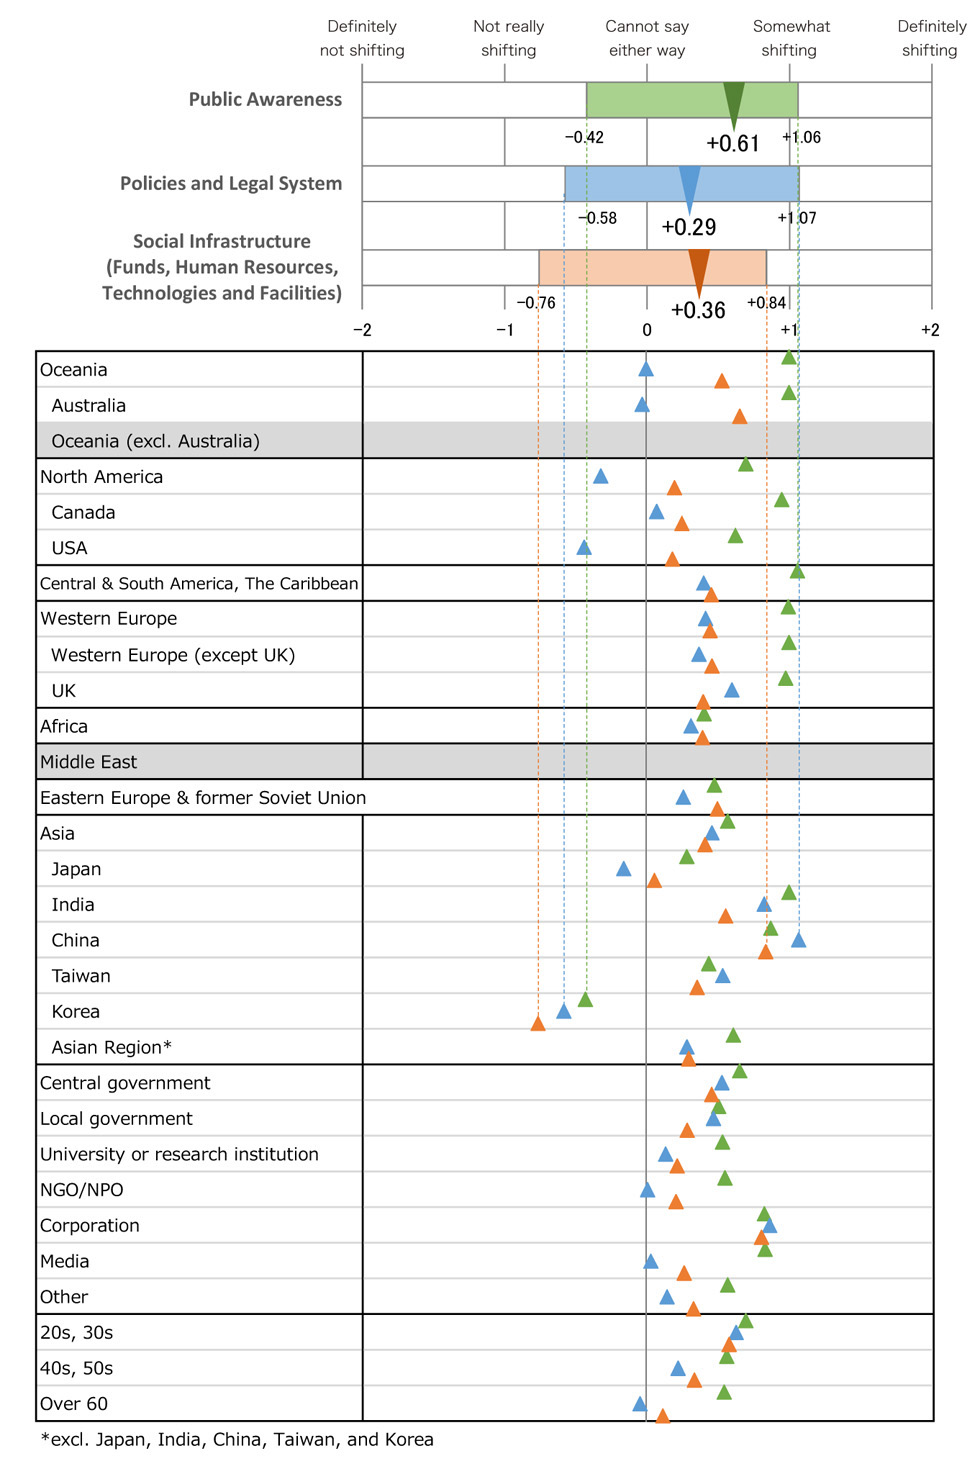
The average score for the entire world and the average score for each region and country are shown in Fig. 16. The world’s average scores are as follows. The figures in the parentheses are the average scores in 2019.
- Public Awareness+0.61(+0.52)
- Policies and Legal System+0.29(+0.27)
- Social Infrastructure+0.36(+0.32)
(Funds, Human Resources, Technologies, and Facilities)
- Overall, the results indicated that there were some signs of improvement in the efforts to transition to a decarbonized society but the same degree of progress was not made in “Policies and Legal System” and “Social Infrastructure (Funds, Human Resources, Technologies, and Facilities)” as in “Public Awareness.” Nonetheless, a positive
change was seen from all three viewpoints, “Public Awareness,” “Polices and Legal System,” and “Social Infrastructure,” in comparison with comparison with the results in 2019. By region, the ratio of respondents who considered that progress had been made in “Public Awareness” was greater in India, Australia, Canada, Central & South America, The Caribbean, and Western Europe than other regions.
- In Japan, Korea, and the USA, the average score for “Policies and Legal System” was negative, indicating that the respondents considered that no progress had been made in this area.
- As in the previous year, the responses from China and Taiwan showed their view that a greater degree of progress had been made in “Policies and Legal System” than in “Public Awareness.”
- Korea was the only country/region whose results showed that no progress had been made in all aspects.
| Fig. 16 Progress in a Transition to a Decarbonized Society: World Average and Average Scores by Region, Organization, and Age Range |
|---|
 |
Question 2-2. Where do you see signs of improvement? Please choose one category from Table 5 that shows a
list “Environmental Issues to be Taken into Account.”
The category most frequently selected for showing signs of improvement was “Climate Change” at 28%, followed by “Lifestyles”and “Society, Economy and Environment, Policies, Measures” both at 14%. Sixteen percentages of the respondents selected the answer, “There are no improvements at all.” The result was quantified in the same manner as in Q2-1 and shown in Table 8.
| Table 8. Signs of Improvement: Selection Percentage and Average Score in Signs of Improvement |
|---|
 |
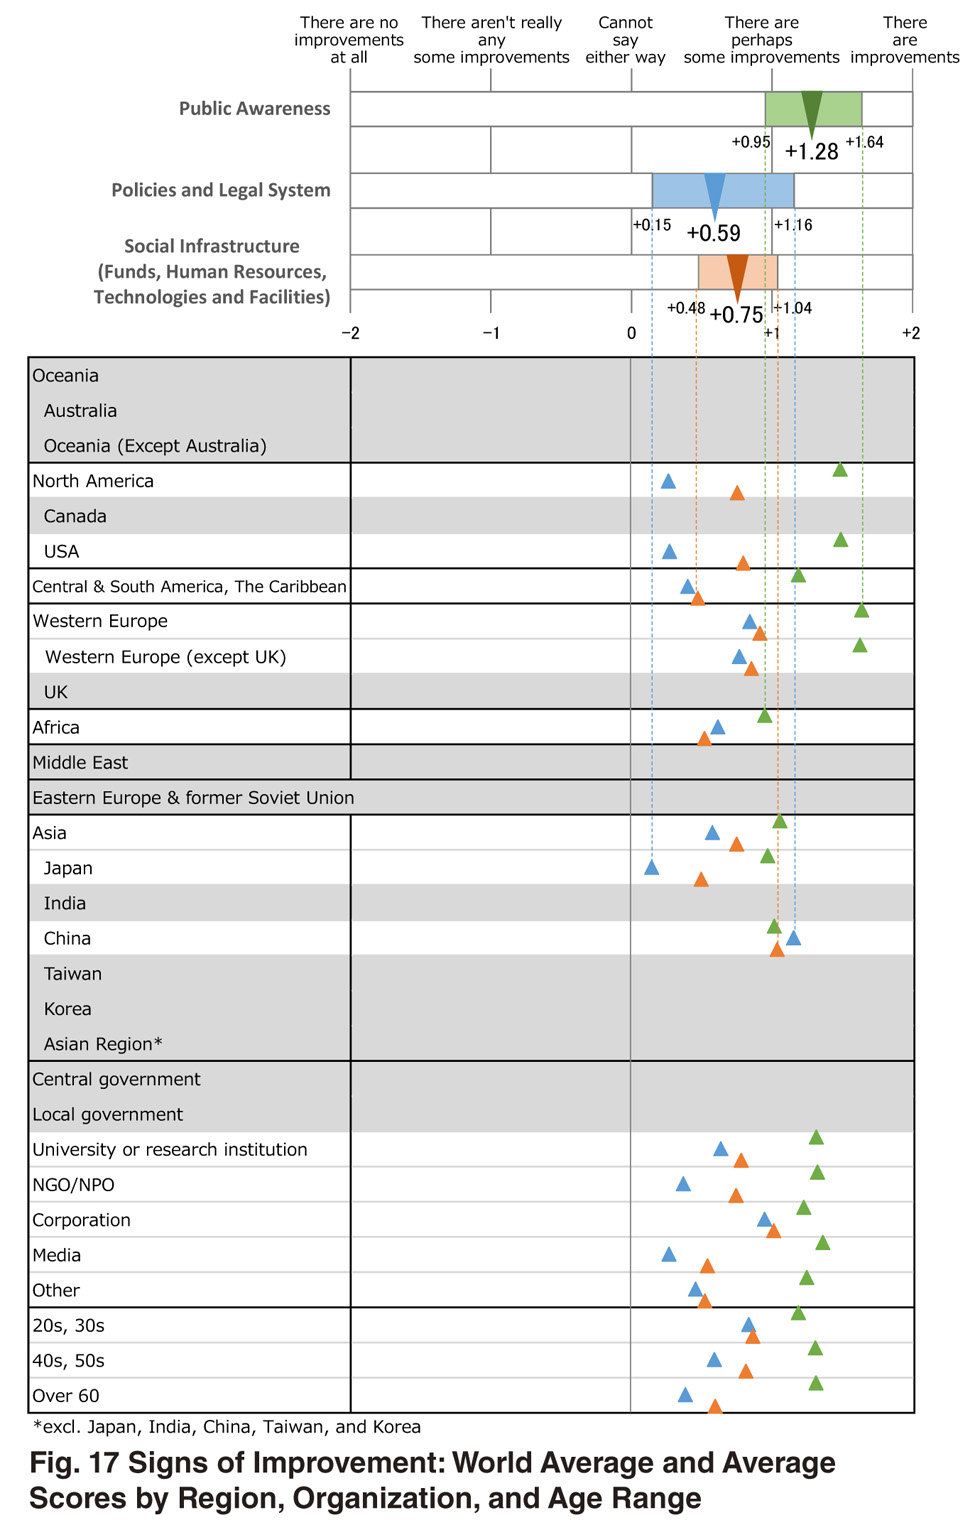
Figure 17 shows the average score of all respondents and the average score of each country and region, in which climate change was most frequently selected and 30 or more samples could be taken.
The average scores for the entire world were as follows. The figures in the parentheses are the figures in 2019.
- Public Awareness+1.28(+1.22)
- Policies and Legal System:+0.59(+0.65)
- Social Infrastructure:+0.75(+0.61)
(Funds, Human Resources, Technologies,and Facilities)
The world’s average score for “Public Awareness” is +1.28, which is greater than the last year, showing that the respondents worldwide recognized signs of improvement. This trend is particularly noticeable in the USA and Western Europe (except UK).
China’s score for “Policies and Legal System”of “+1.16” far outweighs others, while the scores in Japan, the USA, Central and South America, and The Caribbean are smaller at less than “+0.5.”
The scores for “Social Infrastructure (Funds, Human Resources, Technologies, and Facilities)” are relatively high in China and the Middle East, and are lower in Africa, Central and South America, The Caribbean,and Japan.
No graph was created for other indicators due to the small number of samples viewed in each country/region.
| Fig. 17 Signs of Improvement: World Average and Average Scores by Region, Organization, and Age Range |
|---|
 |
Ⅳ. Closing Comment
The average time on the Environmental Doomsday Clock in 2020 at 9:47 has barely changed from the times recorded in the previous two years. The result shows the highest level of sustained crisis awareness since the beginning of the survey in 1992.
With regard to “Environmental Issues to be Taken into Account,” which are used to decide the time on the Clock, 30% of the respondents selected “Climate Change”. The selection rate for this category has been on the rise since 2013, indicating that climate change is considered more urgent than other categories.
As in the previous year, the survey asked the respondents if they saw any signs of improvement in comparison with the situations before 2015 when the Paris Agreement and SDGs were adopted. Given that the respondents’ answer to this question in terms of “Policies and Legal System” and “Social Infrastructure (Funds, Human Resources, Technologies, and Facilities)”varied from one region or country to another, we calculated the average scores for the entire world and for each region/country and showed them as graphs to display an overall image and regional distribution.
With regard to a transition to a decarbonized society in Question 2-1, there were regional differences in the respondents’perception of improvements made in “Public Awareness” and “Policies and Legal System.” In China and Taiwan, the difference in the scores for the two was small, with “Policies and Legal System” being perceived as having made a slightly greater degree of improvement than “Public Awareness.” In contrast, the difference between the two issues was significant in Australia and the USA, with “Policies and Legal System” considered to be falling significantly behind “Public Awareness.” These results indicate that, while in China and Taiwan people’s awareness is not keeping up with the measures the governments are taking proactively, in Australia and the USA, the governments’ measures are not keeping up with a strong concern their citizens have. Looking at the responses to this question by generation, the older the age group gets, the greater the difference between the perception of improvements made in “Public Awareness” and “Policies and Legal System” grows—that is, the older respondents tend to consider that the governments’ measures were not improving as fast as their citizens’ awareness.
In Question 2-2, the categories showing signs of improvement in the approach to environmental issues were as follows in the descending order of the selection rate: “Climate Change” at 28%, “Lifestyles” at 14%, “Society, Economy and Environment, Policies, Measures” at 14%, and “Biosphere Integrity (Biodiversity)” at 8%. “Climate Change” was also selected most frequently as a category that was important in considering environmental issues in Q1. This shows the strong worldwide interest in the “Climate Change” issue and the efforts to improve it. Meanwhile, “Biosphere Integrity (Biodiversity),” which was also a factor in moving the time on the Clock closer to midnight, was the second most frequently selected category in Q1 but ranked fourth as the categories showing signs of improvement. It is thus feared that the situation concerning “Biosphere Integrity (Biodiversity)” is serious but there are not many perceived signs of improvement.
We will continue using the above questions for a while and continue conducting this survey, paying attention to the average scores for the entire world and variances among regions and countries.
Looking back at the worldwide environmental incidents in the year immediately preceding the response period of this survey, there were many widely reported news events such as bush fires in Australia and Brazil from 2019 to early 2020, a desert locust plague in Africa, flooding in Venice, Italy, and a record high temperature of 38 degrees Celsius in the Arctic Circle. It may be interesting to read this report imagining that these incidents might have influenced the responses in each location.